How does this year’s codling moth development in Washington compare to past seasons?
2022 is shaping up to be an unusual year weather-wise, especially as we come off 2021 which is an outlier in its own right.
In this update we will:
Below you’ll find graphs of the average daily and cumulative degree days by county for the last four growing seasons in Washington State.
How to interpret the graphs
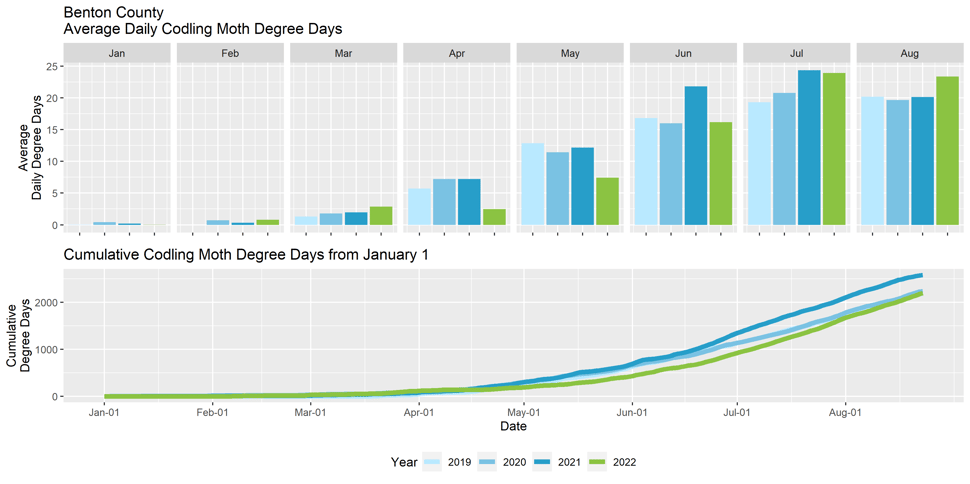
- The top graph shows the average daily codling moth degree days by month. In general, the daily degree days accumulated between March and June is less than those observed in 2021, 2020, and 2019.
However, all this changed in July. Since then, we have seen some of the highest daily codling moth degree day accumulations in the last 3 years, particularly in the first half of August. - The bottom panel shows the average cumulative codling moth degree days from January 1.
Looking at 2022, you will see that although we have been lagging for most of the season compared to the previous three seasons, the recent warmer weather in July and August has gotten us back on track with accumulations that are aligned with 2019/2020.
This warmer weather is also closing the gap on the difference between this season and 2021.
Here's an example of what the degree days situation is looking like for Benton County:
View the monthly degree day accumulation by county for the last four seasons in Washington State:
- Adams County
- Benton County
- Chelan County
- Columbia County
- Douglas County
- Franklin County
- Grant County
- Kittitas County
- Klickitat County
- Okanogan County
- Walla Walla County
- Yakima County
How does this codling moth degree day accumulation translate to calendar days?
Now that we understand the difference in degree days, what does that look like on the calendar?
The table below shows that individual counties are between 17 and 23 calendar days behind 2021:
.png?width=600&name=2022%20is%20X%20days%20behind%20(2).png)
The numbers in each column show how many calendar days we are behind in codling moth degree days accumulation on average compared to previous years in each county.
It’s important to remember that these are just averages, and many counties can experience considerable variability farm to farm.
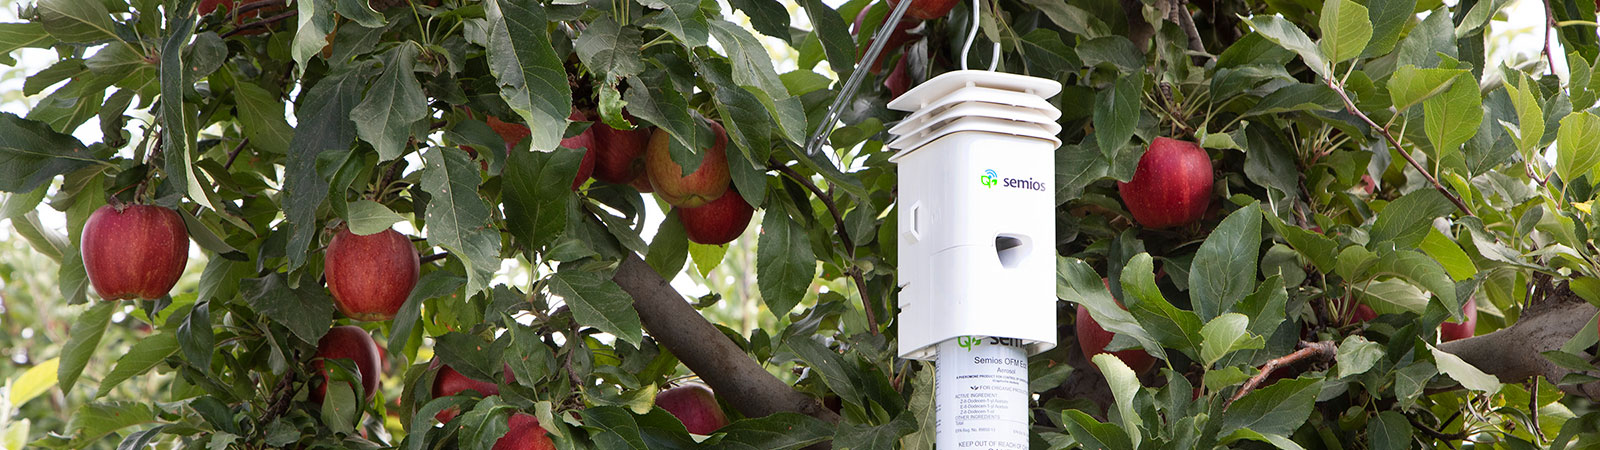
If you’re a Semios user, be sure to view your ‘Compare Seasons’ tool to see your site’s specific in-canopy degree day and trap catch data year over year. Log in now.
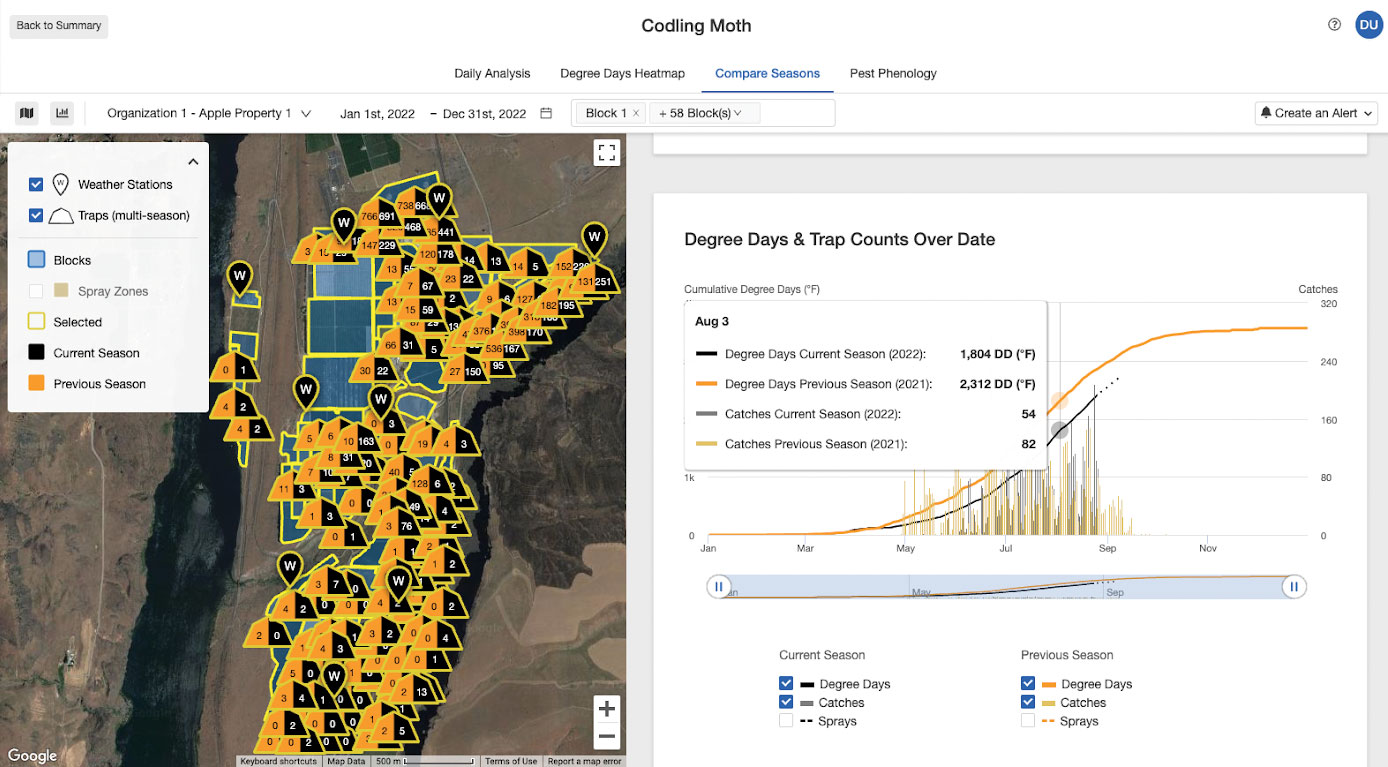
From the Semios Codling Moth Compare Seasons page, users can track how their current in-canopy degree days accumulation compares to the previous season.
Considerations for your farm
- While it’s quite hot right now, the cumulative degree days across Washington state suggest that 2021 isn’t a good benchmark for 2022, due to a cool spring and early summer. Checking back to years prior as a whole may provide more useful insights into what environmental factors are at play.
- Codling moth flights should occur later (on a calendar day), compared to 2021. Growers who have used Semios for two or more seasons can easily see this data using the Compare Seasons Tool which shows trap captures and flight patterns for this season and last season. The variation in degree day accumulations demonstrates one of the hazards of calendar spraying – each year is unique so it's always better to check trap captures and on-farm degree day accumulations to plan your management.
- While the weather has affected codling moth behavior and flight timings, we won't have a clear picture of just how much until next season. Codling moth spring emergence will be something to watch closely in 2023 to get an idea of how these factors have affected next season’s codling moth population size.

.jpg?width=352&name=_MG_4127%20(1).jpg)