How did this year’s Navel Orangeworm (NOW) trends shape up in the Central Valley? With the largest trapping network in the region, we’ve gathered a season’s worth of data to help answer that question.
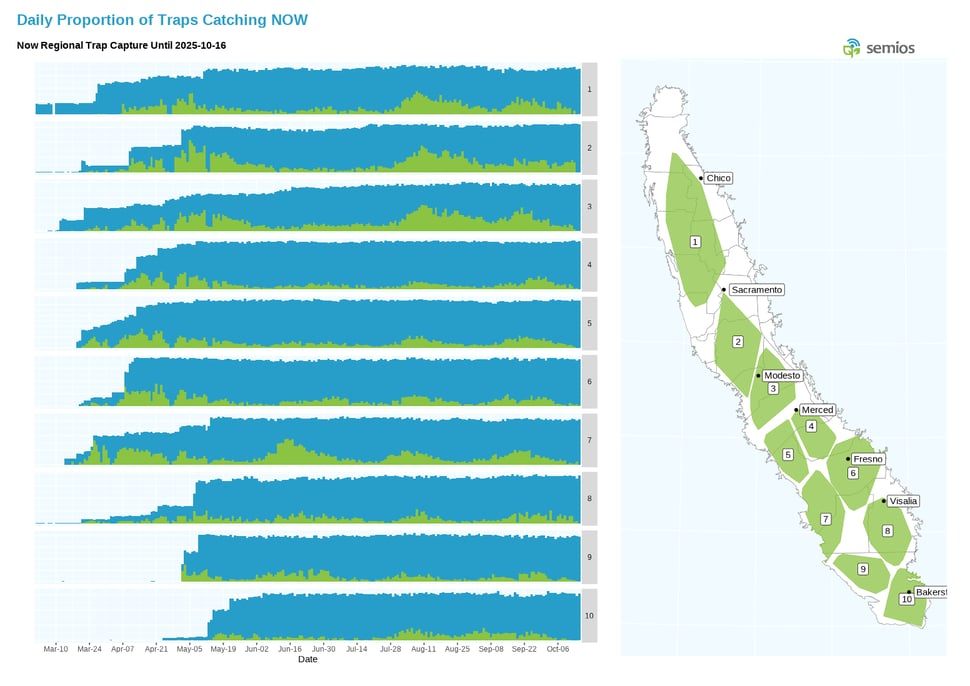
The following report covers the Central Valley, which is divided into 10 regions. Each region is supported by a minimum of 50 camera traps. This view shows how NOW pressure has varied throughout the season.
Understanding the Graph
- The graph below shows daily captures from each region.
- Blue bars indicate the total number of active traps each day.
- Green bars represent traps that specifically captured NOW moths.
Key Observations
Spring populations were high across the Valley, but the northern regions (1–3) and region 7 didn’t see a decline in subsequent flights. There were heavy third and fourth flights in the northern valley. We continue to see the trend of these flights merging, creating constant NOW pressure in the latter part of the season.
How to Get Pest Reports Specific to Your Farm?
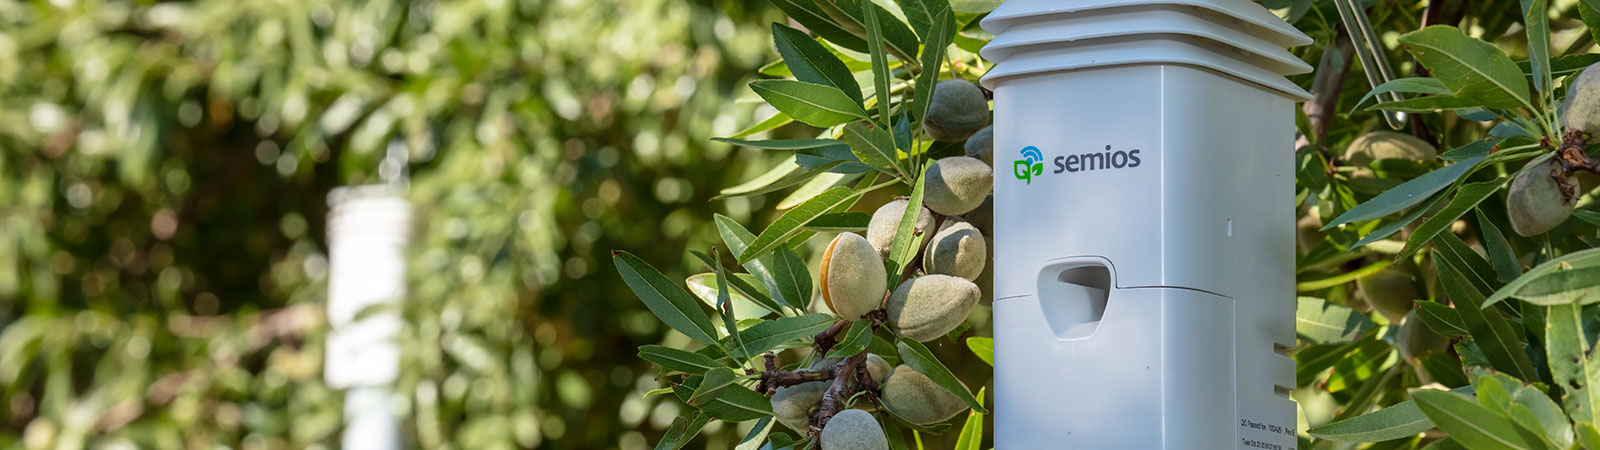
If you have a Semios Camera Trap in your field, we'll be able to provide you with reports tailored to your farm, along with regional trap capture reports. This will help you get a clear picture of pest activity.
Here is a sneak peek into the other benefits our Semios Camera Trap bring to your operation:
How Semios Camera Trapping Helps Your Farm
-
View daily trap catches remotely for critical insights.
-
Monitor navel orangeworm flights even under mating disruption.
-
Identify blocks with high pest pressure to streamline scouting.
-
Track in-season and year-over-year population trends.
-
Create automated reports and alerts to stay informed of crucial events.
.png?width=352&name=Cumulative%20NOW%20Degree%20Days%20-%20April%201%20Biofix%20(1).png)