As we near the end of this season's second California Red Scale (CRS) flight, here's an update on the pest activity patterns we're seeing based on region-wide trapping using our automated CRS camera traps, and other monitoring tools.
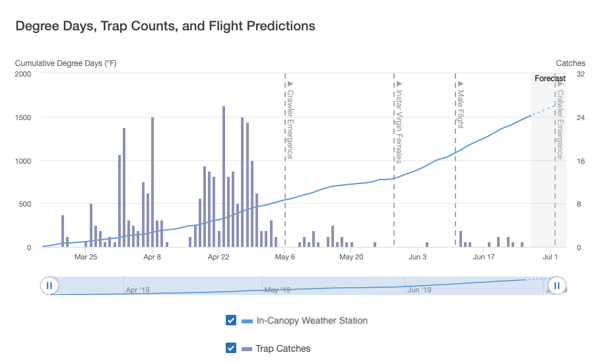
Below are a set of graphs showing year-to-date degree days, trap counts, and flight predictions at ranches in Sanger, Wood Lake, Strathmore, and Porterville. Here's what we're seeing so far.
Sanger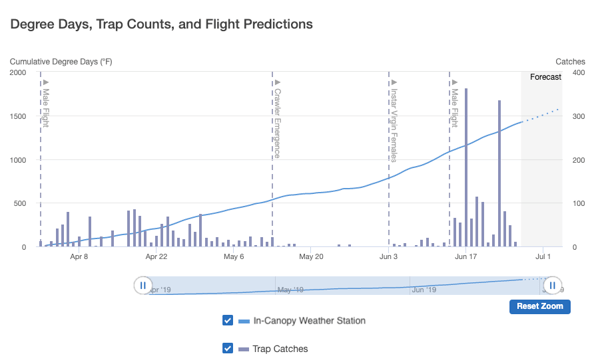

Wood Lake
Strathmore

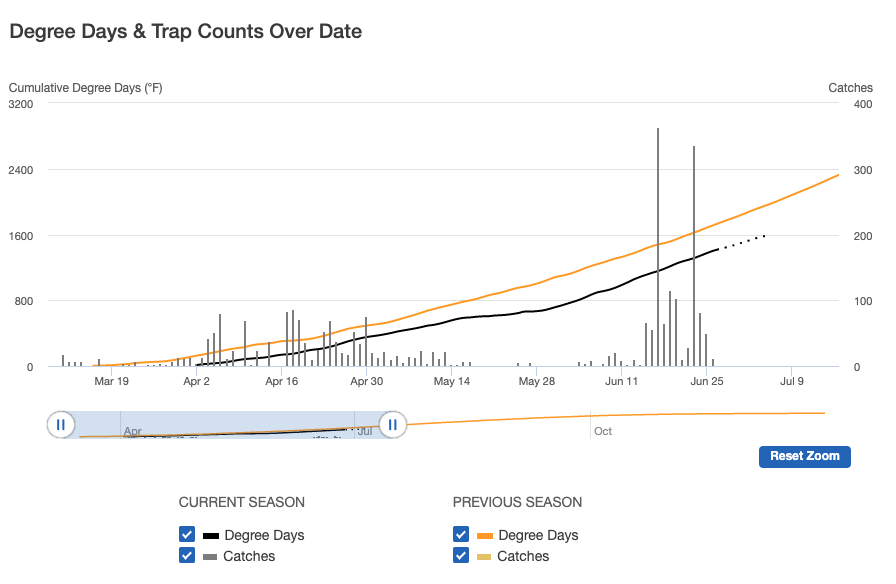
Porterville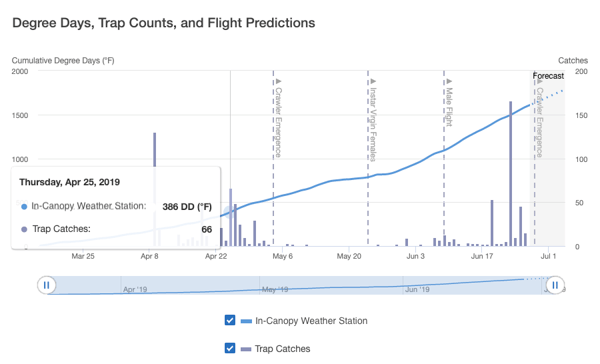
The dotted lines indicate crawler emergence, instar virgin female emergence, and male flight. Notice that flights (vertical blue bars) end around crawler emergence and pick back up at the next predicted flight.
The good news?
So far, the activity we're monitoring lines up very well with the accepted CRS degree day model, so growers should feel confident planning applications accordingly.
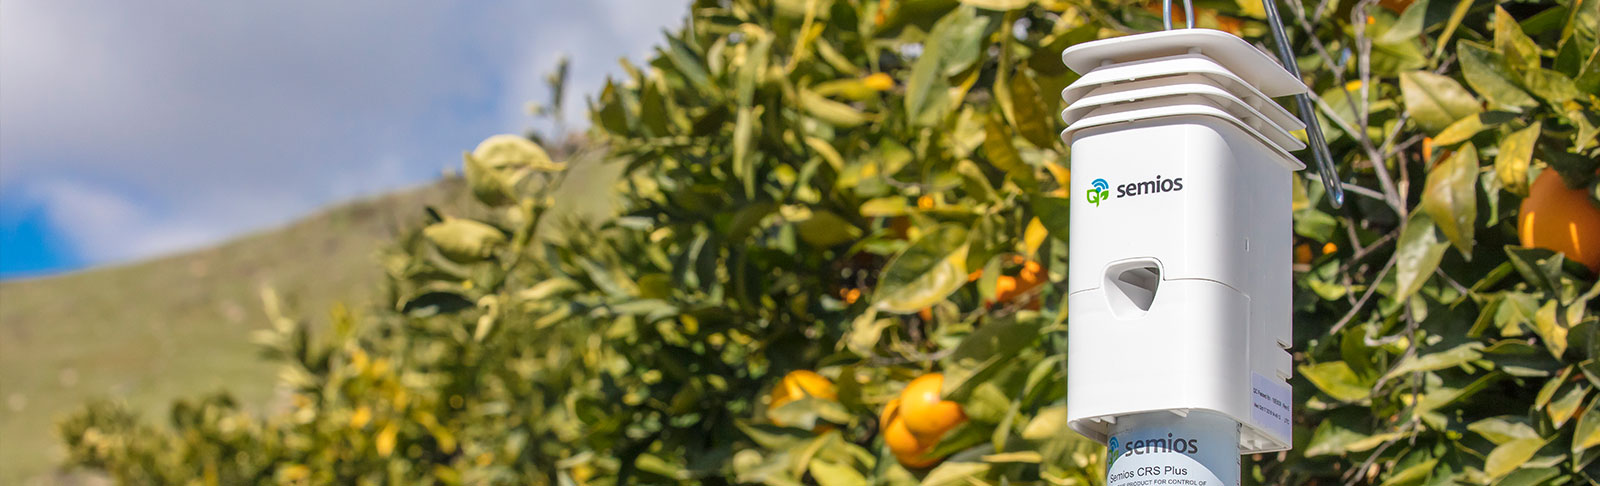
Semios weather stations and pheromone dispensers track temperature, barometric pressure, and humidity every ten minutes giving customers accurate insight into their orchard's climatic conditions - right down to the acre.
Using these granular insights, Semios citrus growers have access to an online web and mobile dashboard that provides a detailed look into their orchard's pest, disease, and climatic conditions. Growers can keep track of degree days, trap counts, and flight predictions and, if they've been using Semios for two years, can see how this season compares to their last.
Semios growers can even set CRS alerts and be automatically notified via text or email when key pest thresholds are met. Many growers use this feature to help time applications for maximum efficacy.
We'll continue to monitor CRS through to the end of the season and will update you with our post season analysis.