.jpg?width=600&name=_MG_4097%20(3).jpg)
Insect phenology models are invaluable in the Integrated Pest Management (IPM) toolbox. They help consultants and growers predict key events in a pest’s life cycle, and enables them to target sprays for maximum impact.
While it’s fantastic that state extension services have made these models widely available for commercial adoption, using a general, or ‘one size fits all’ approach to pest modelling doesn’t always line up with the unique conditions occurring in an orchard.
Next Generation Pest Phenology Modelling
Fortunately, advances in microclimate monitoring have allowed for site-specific pest modelling that can be tailored to a location’s unique set of environmental conditions. This next generation of pest phenology modelling, allows growers to apply sprays so they are more accurate and effective.
A Little History
Codling moth phenology models have been used in Washington since the 1980’s when Jay Brunner and his colleagues adapted a model that had been developed in Michigan a decade earlier. The model developed in Michigan, known as the PETE model, was a game changer in that it allowed researchers to easily share their models for practical use for the first time. Growers and extension services simply had to input temperature data from their site, or a local weather station, and relevant pest predictions would be generated.
While this made phenology models more accessible, generalized models have never been designed to account for all the different variables in the landscape that might affect pest phenology.
It is well known that population phenologies can differ from region to region. Indeed in 2007, Alan Knight presented a new model based on seven sites in Washington, which fit the observed first flight and egg hatch better than the Michigan model. The new model suggested that 50% egg hatch occurred 100 DDF later than what the Michigan model predicted. Knight speculated that the differences between the two models was because of the wide adoption of mating disruption and change in management practices in Washington.
Putting The Data To Work
At Semios we process daily trap capture data for orchards throughout the Columbia Valley in Washington. From what we’ve observed, the model currently in commercial use can vary in its ability to predict pest populations from one grower to another.
Here is a comparison of the codling moth model currently used in Washington State and actual observed trap capture data for two of our Grant County customers from 2017.
Example 1
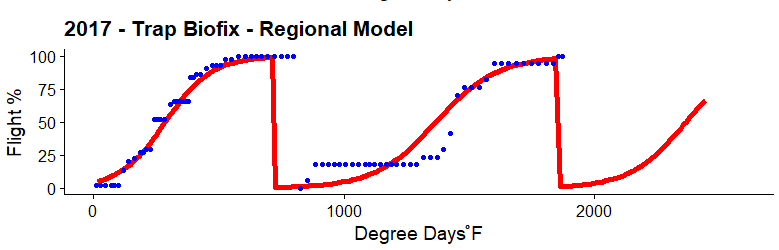
Example 1. Generalized model predicted % flight curves based on trap biofix (red) and 2017 observed flight (blue) against degree days Fahrenheit.
Example 2
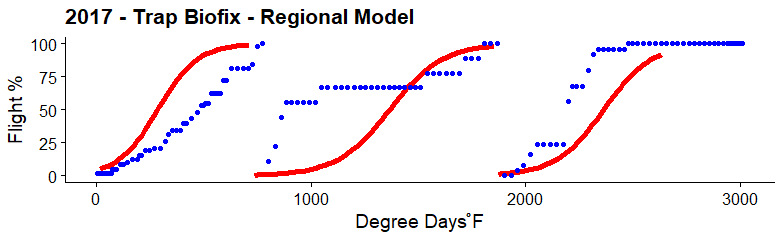
Example 2. Generalized model predicted % flight curves based on trap biofix (red) and 2017 observed flight (blue) against degree days Fahrenheit.
These are charts of cumulative, percent trap catches per codling moth generation predicted over a degree-day-accumulations timeline.
- The red line represents the current model used commercially in Washington
- The blue dots are actual observed data from Semios traps on site.
In Example 1, the blue dots closely follow the red line in the first generation, indicating that the generalized model was a good predictor of the population dynamics within this orchard.
In Example 2, it’s not hard to see that none of the three generations align well with the generalized model. In this example, the observed flight (blue) does not closely follow the generalized model (red), with 50% flight in the first generation occurring approximately 160 degree days later than predicted, roughly 10 calendar days. This first flight bleeds into the second generation, and can be seen by the increasing flight in the second generation, later resulting in all three generations not aligning well with the generalized model.
More Data Means Deeper Insights
Using site-level trap-capture data collected from over 40 Washington orchards, we can compare each location's cumulative flight against the generalized model. It quickly becomes clear that the generalized model poorly predicts adult trap catch in more than a few cases. This can be seen in detail in Example 3.
The generalized generalized model is represented by the black dots, while each other color represents the cumulative flight of a different orchard. While it’s clear that a few sites track the generalized model fairly well, more importantly, a significant portion do not, with some exhibiting 50% flight taking place up to 500 degree days later, translating into almost 20 calendar days.
Example 3
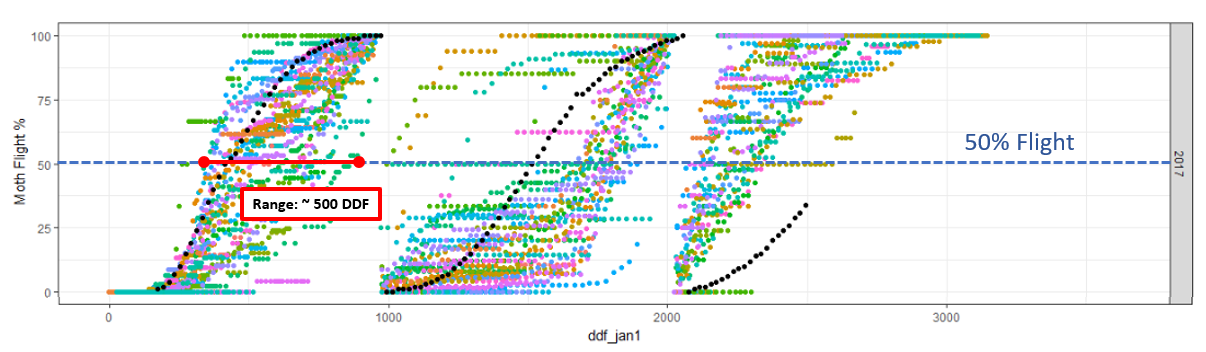
Example 3. Washington model predicted % flight curves (black) and Semios observed flight for 40 sites. Each colour represents a different site. Where the 50% flight line (horizontal dashed blue) and the predicted flight (black) intersect indicates the number of degree days at which 50% flight is predicted.
Generalized models are often developed on a limited number of sites, and do not take into account other factors that can affect insect development including:
- Microclimate
- Genetics
- Crop management practices and the presence of alternate hosts.
In the upcoming Part 2 of this blog series, we will explore how Semios is leveraging our dataset to provide growers with high-precision, site-specific pest models designed to help improve control of this economically damaging pest.
Feel free to reach out with any questions using the form below.
Related Posts
The Benefits of In-Canopy Weather Stations
Understanding Variable Rate Mating Disruption