This year, we've been hearing from citrus growers that their observations from their field scouting are not lining up with the conventional California Red Scale (CRS) model. Using our data on site-level CRS trap catches, we're taking a closer look at whether our data can support these findings and the reasons why it may be happening.
How is California Red Scale Phenology Tracked?
In California, the most common method for predicting the phenology of California Red Scale (CRS) is by focusing on the 1100 Degree Days Fahrenheit (DDF), the generational timeline between peaks of any given lifestage.
We can expect peak crawler emergence at 550 DDF after each peak male flight. This stage is highly important for proper application timings of systemics or contact insecticides.
Observations from the Orchard
Recent conversations with citrus growers in the Central Valley have brought up a few recurring themes:
- It is common that detection of crawlers during regular field scouting does not appear to line up with the spring biofix model (at 550, 1650, 2750, 3850 DDF after first flight biofix).
- There is consensus in the industry that being able to detect male CRS in traps during the third flight is limited by an undetermined biotic or abiotic factor. Our takeaway? It may not be wise to ignore the possibility of a third flight if you’re not finding males in your traps.
- As the growing season progresses, the likelihood that male flights will overlap increases. Therefore, identifying distinct flights that match the conventional phenology model is not possible.
What Does the Field Data Say?
In an effort to support our California citrus growers, we evaluated site-level trap catches across our data set to see how they line up with industry-standard commercial CRS management practices.
Our first step was to look at our entire trap capture dataset from 21 commercially managed citrus sites under mating disruption and ask ourselves, how many flights can we see?
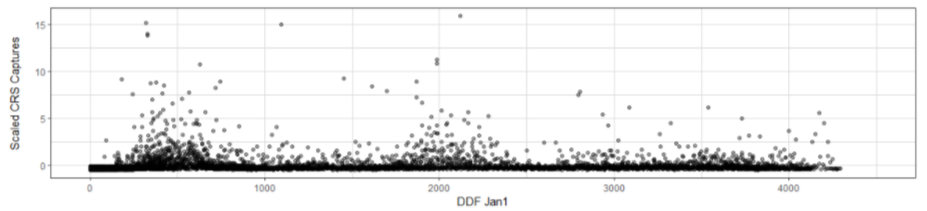
Fig 1. CRS adult male trap captures over degree days Fahrenheit from January 1, 2021. CRS trap captures are rescaled for easier viewing.
Our aggregate data would suggest a first and second distinct flight that are 1300-1500 DDF apart. This differs from the industry accepted timeline of 1100 DDF by 200-400 DDF.
During the period in which these first flights occur, this is equal to 7-14 calendar days difference. Additionally, we can see a third flight with a higher pressure density another 1500 DDF after the 2nd.
Taking a closer look at each site independently, 80% of the sites show a DDF timing of 1500 DDF between flights 1 and 2. whereas 20% show the standard 1100 DDF timing. In all cases, however, the period of time between the 2nd and 3rd flight was 1500 DDF. In general, these differences between sites were consistent year over year.
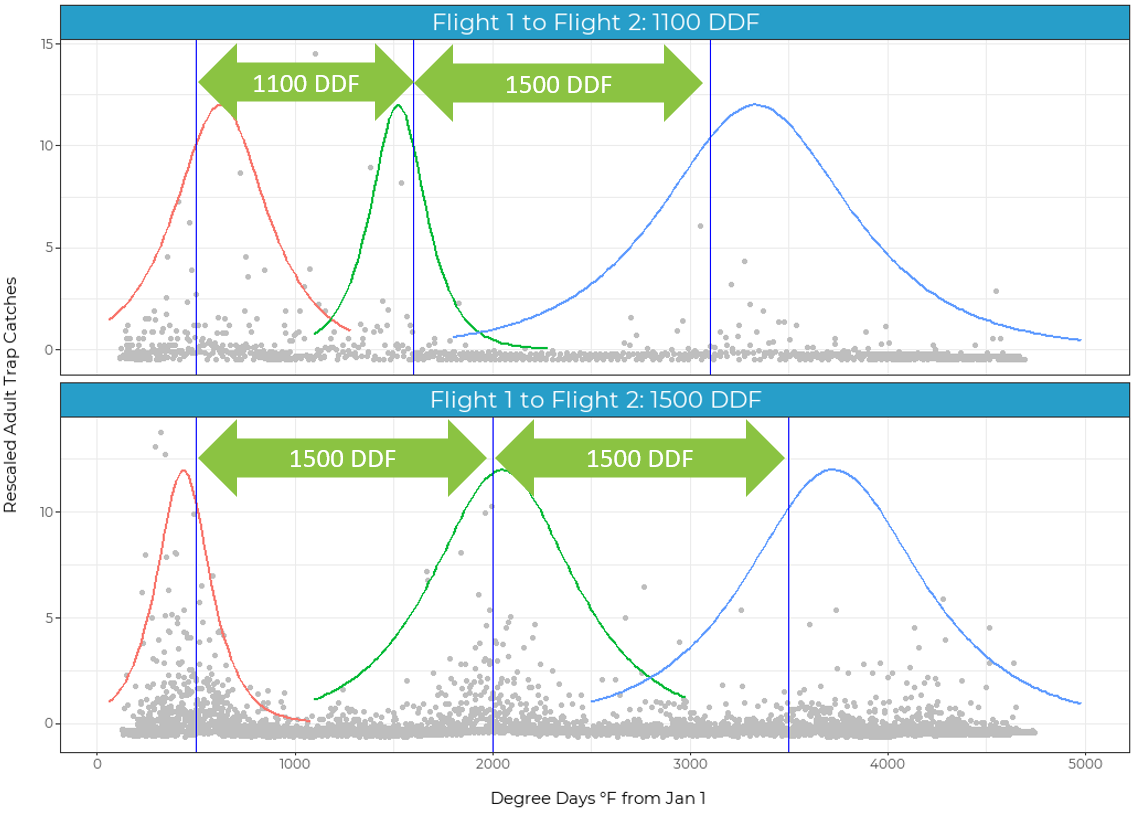
Fig 2. CRS adult male trap captures over Degree Days Fahrenheit from January 1, 2021 for sites that have 1100 DDF between first two flight peaks (above) and sites that have 1500 DDF between first two flight peaks (below). Sites with 1500 DDF between the first two flights accounted for 80% of the sites studied.
Why are we Seeing a Departure from the Conventional California Red Scale Model?
There are a number of things that could lead to this departure from the conventional model, such as:
- Changes in product selection
- Changes in use patterns
- The increasing use of mating disruption or,
- Long term selection for populations with longer generation timelines that evade management
Interestingly, despite a longer generation length between peak male captures, we found that peak crawler emergence was still found at ~550 DDF after peak male flights in our 2021 field data from two sites. This is in line with industry expectations.
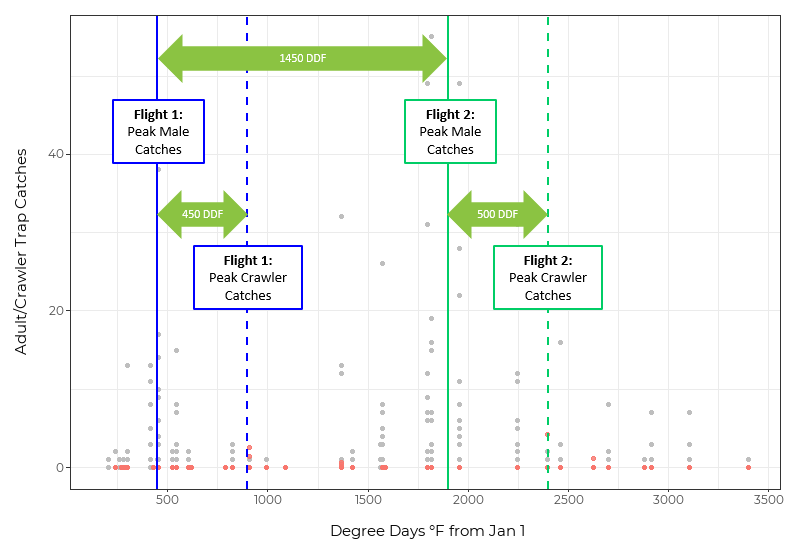
Fig 3. CRS adult male trap captures (grey) and crawler tape trap captures (red). Peak male captures occurred 1450 DDF apart. Peak crawler emergence occurred ~450-500 DDF after peak male flights.
The Elusive Third California Red Scale Flight
Based on what we are seeing in our dataset, we found that using insights from multiple sites could lead to the perception that the third and fourth flights overlap, due to site-level variances in pest phenology.
The sites that depart from the conventional model that have 1500 degree-days between all flights would lead to a third observed flight at ~3000 DDF, whereas the commercial model would predict a third flight at 2200 DDF and a fourth flight at 3300 DDF.
This actual observed timing of a third peak at 3000 DDF after the first could give the sense of a missing third flight or an overlapping of the third and fourth flights in the context of the conventional model.
Get to Know your California Red Scale Populations with Semios
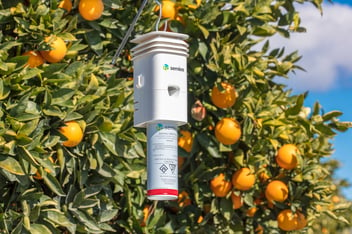
Semios provides daily CRS trap counts and on-site degree day accumulation tracking so that growers can better understand the CRS populations in their blocks.
In Frewin et al (2019), it was determined that Semios’ remote wireless camera traps could be used in a similar fashion to the conventional sticky card traps to monitor CRS in commercial settings.
By using camera traps alongside field scouting, we hope growers and their consultants will be better able to assess when and how populations vary at a site-level and streamline their CRS management practices.
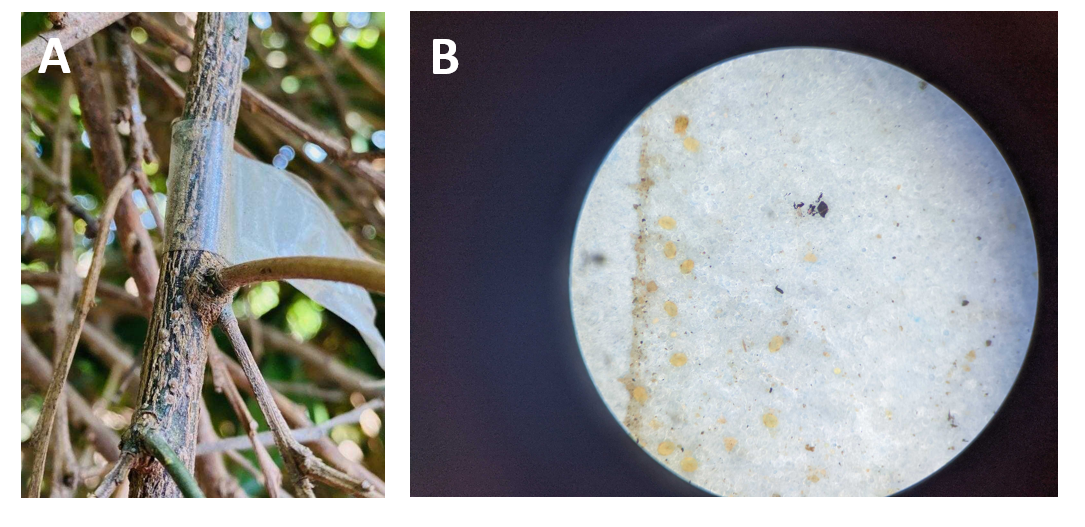
Fig 5. Back up your phenology models with scouting and trapping for different life stages of CRS. (A) crawler tape (B) crawlers caught on tape