Navel orangeworm (NOW) is a highly damaging and challenging pest to manage for California almond and pistachio growers.
In this guide, we'll be sharing the latest updates and tools to help growers better manage NOW. This includes reports on data gathered from the expansive Semios network of in-canopy sensors, and insights from the Semios in-house research team of PCAs, agronomists, entomologists, and irrigation specialists.
What's Covered in This Guide
Use the list below to quickly jump to different sections:
- 2022 Regional Hull Split Forecast
- 2022 Navel Orangeworm (NOW) Update
- General Spray Timing Tools for Navel Orangeworm (NOW) Management
- Navel Orangeworm (NOW) Management at Hull Split
2022 Regional Hull Split Forecast
Using data from our in-canopy weather station network and the regional full bloom model, we've created the following regional map of forecasted 1% hull split dates for nonpareil almonds.
We're expecting to see about a 2-week span across the Central Valley for nonpareils to reach 1% hull split.
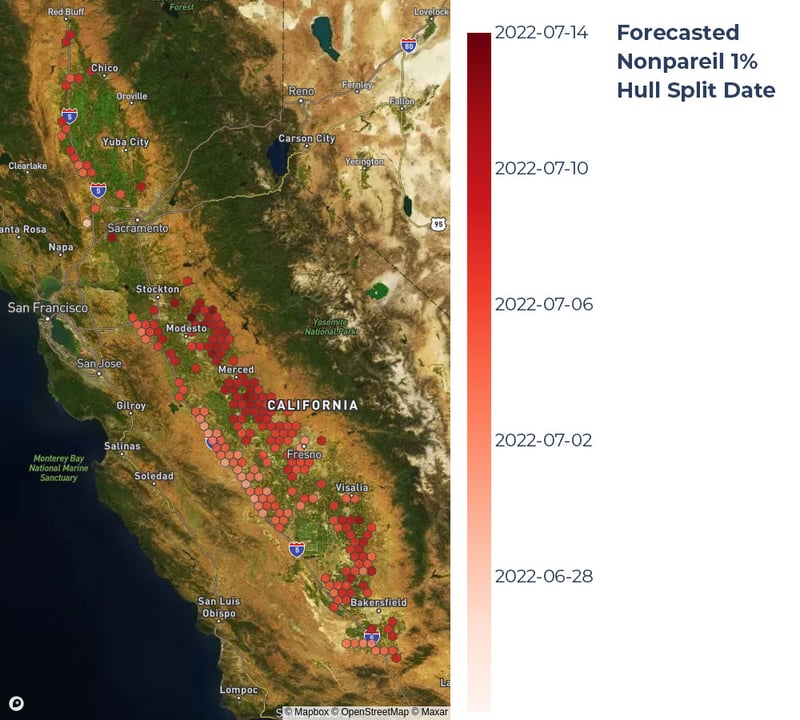 A map of California showing the predicted nonpareil 1% hull split dates for the 2022 season. Areas with the earliest predicted 1% split dates (late June) are shown in the lightest peach color, and areas with the latest predicted 1% split dates (mid-July) are shown in the darkest red color.
Note that these predicted hull split dates do not account for the impact of plant water status leading up to split. Moderate amounts of water stress can lead to nuts splitting earlier, whereas severe stress has been shown to delay hull split.
2022 Navel Orangeworm (NOW) Update
Semios started monitoring navel orangeworm (NOW) activity for the 2022 season throughout the Central Valley in late February this year, and it did not take long for us to catch our first moths.
Average NOW Trap Catches in Central Valley
Here are our average year-to-date trap catches for the 2022 season so far, from late February to mid-April.
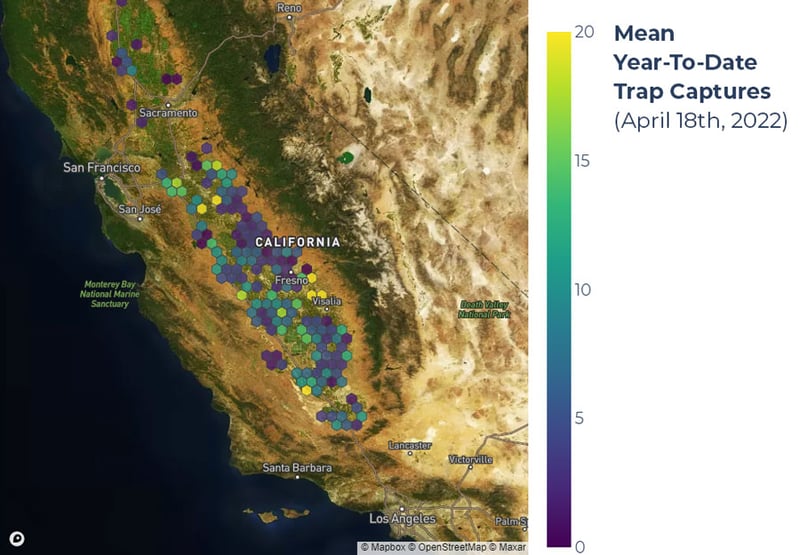 A map of California showing the average year-to-date NOW trap catches for the 2022 season up to April 18th. The light yellow and green areas highlight regions with higher trap catches, while the dark blue and purple areas caught fewer or no trap catches on average.
Some general observations of NOW trap catch patterns include:
- Higher NOW activity on the southwestern limits of the San Joaquin Valley.
- Lower NOW activity up North near Sacramento.
Comparison of Trap Catches in Almonds and Pistachios by County
In the two charts below, we took a look at how NOW trap catches varied over time in almonds and pistachios in Fresno, Kern, Kings, and Madera counties.
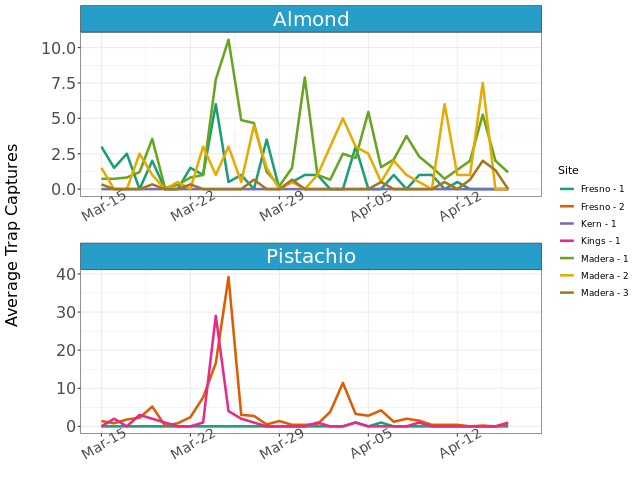
Traps set in almonds have been consistently active since February, whereas we recorded peak activity in pistachios during the last week of March in Fresno and Kings counties.
General Spray Timing Tools for NOW Management
1. Set your biofix and degree days alerts
Traps may not provide a clear picture of NOW flights for those of you using mating disruption. By placing egg traps in your NOW hot spots, you can set a biofix to track NOW development.
Stay on top of key degree days thresholds to ensure your spray timing is well aligned with NOW activity on your farm with the help of the following Semios tools:
- Cumulative degree days graph and forecasting
- Degree day alerts
- Growing degree day calculator
All of the tools above use in-canopy degree day readings for the most accurate reporting.
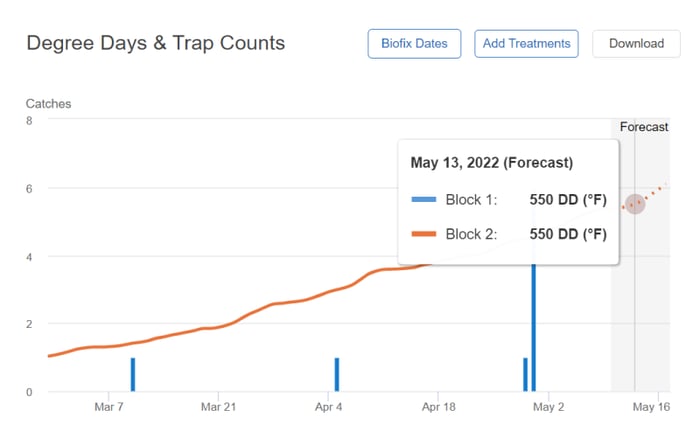 Semios' Degree Days Graph and Forecast
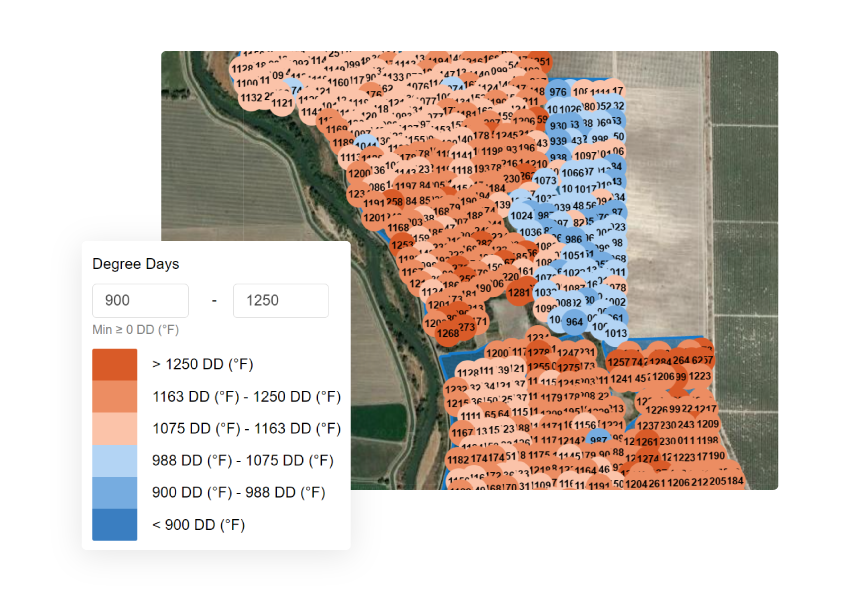
2. Check your farm's hot spots using a per-acre degree day heatmap
For those with a lot of area to cover, the per-acre degree days heatmap helps identify where to start spraying first. Target the warmer, more vulnerable areas first to boost the efficacy of your sprays.
 Semios' Per-Acre Degree Days Heatmap
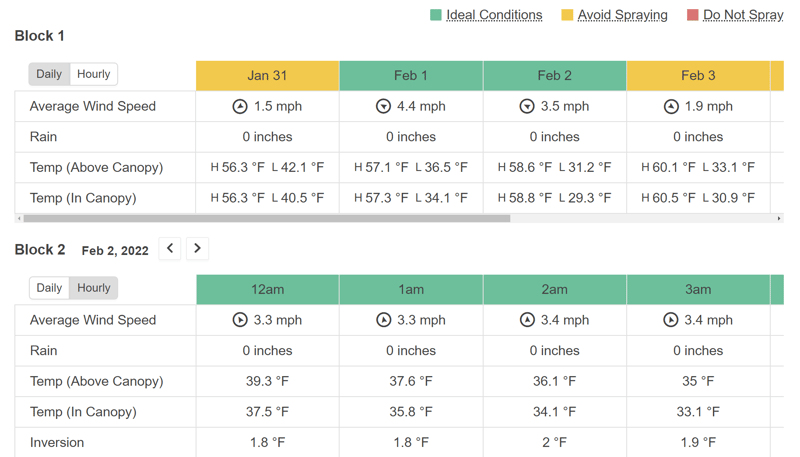
3. Check the spray conditions forecast
After narrowing down the dates, how do you know precisely when you should spray for maximum impact? Semios provides a daily and hourly spray conditions forecast that factors in wind, rain, environmental temperatures, and inversion data.
Look for time slots highlighted in green since those will have ideal conditions for spraying:
 Semios' Spray Conditions Forecast
NOW Management at Hull Split
When hull split is around the corner, it means it’s time to review your spray strategy for the season.
While percent damage in previous seasons can give you a sense of how successful your NOW management program was, it can be hard to find the answers when things don’t go according to plan. Looking at how your sprays were timed, relative to the industry may give an indication if something is amiss in your spray program.
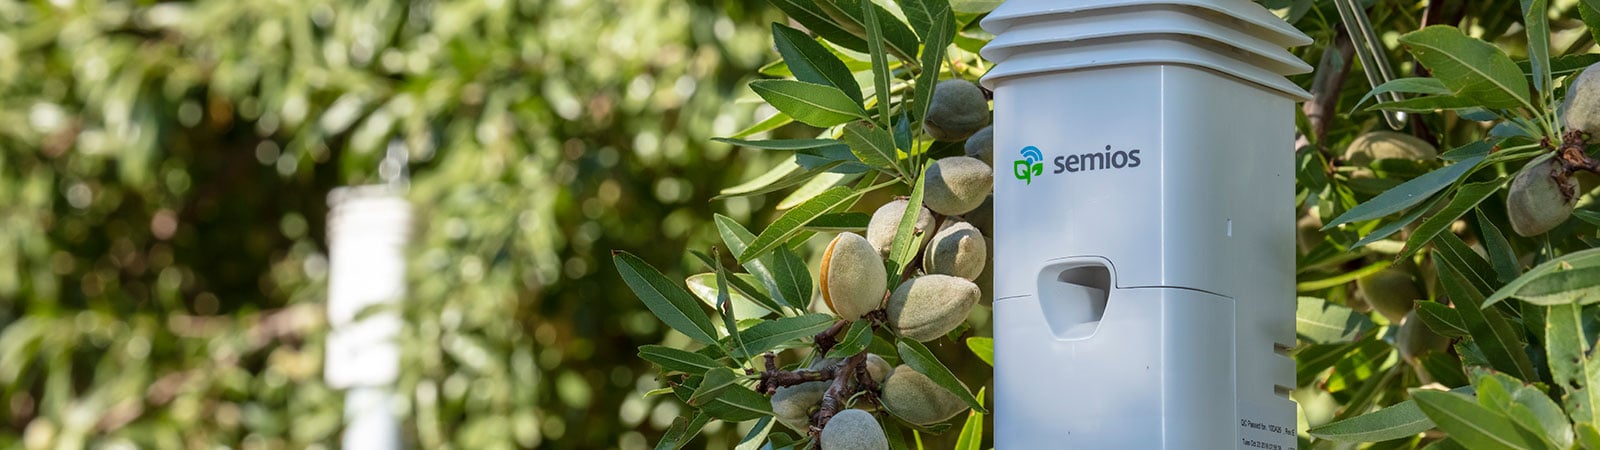
.jpg?width=600&name=_MG_6808%20(1).jpg)
How Many Hull Split Sprays Are Needed?
After orchard sanitation, spray timings are critical for a successful NOW management strategy. New almond crop becomes susceptible to NOW at hull split; as nuts begin to split, volatiles are released that attract females looking for that perfect food source for their young.
This is why UC Extension recommends that NOW sprays are applied at 1% hull split, followed by a second application two weeks later. This second application coincides with pollinizer hull split, as well as when some products lose their residual effect.
Finally, when populations are high, a third spray, or sometimes even a fourth may be recommended.
While the guidelines seem simple to follow, material application decisions are not as straightforward as just spraying at hull split. Many factors come into play including logistics, the speed of hull split progression, and pest development. It’s also important to keep in mind that, earlier spray applications may be needed if NOW peak flight occurs early or if rainfall is predicted around hull split.
3 Factors That Make Hull Split Applications Challenging
- Variability across a ranch
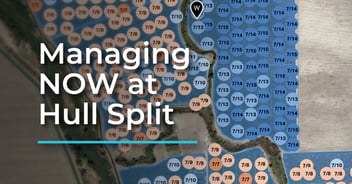
Hull split doesn’t always happen uniformly across a property. Some growers can even experience a 7-day range in hull split forecasts from one block to another. Knowing where hulls will split starts can help you know where to send your rigs first.
The example below shows a California customer’s predicted hull split on a per acre level. You can see the west side of the property is expected to split first, July 7, while the east side is forecast to split a week later on July 15.
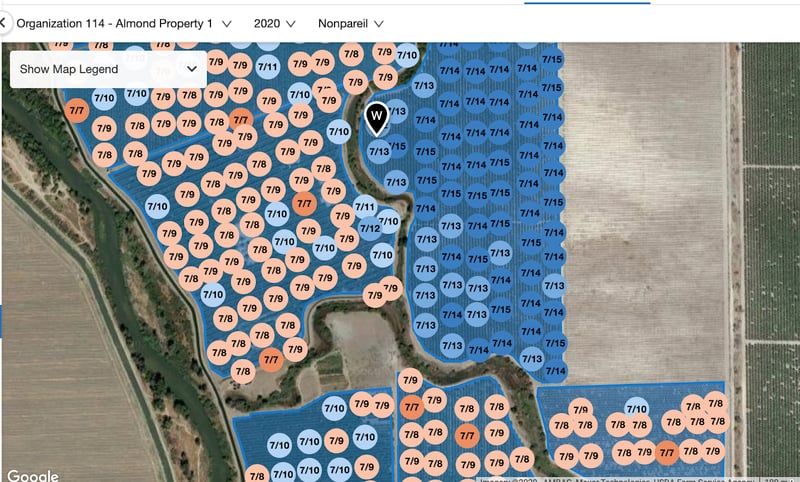
Example of a California almond orchard per acre hull split forecast heatmap
- Irrigation challenges
It’s essential to ensure your field is dried out enough to get spray rigs through without creating ruts or getting stuck. Having advanced notice of when your hulls will split will ensure you plan irrigation accordingly. - Logistics
Getting enough spray rigs to do the job in a timely manner can be tough. The more notice and the more insight you have as to where hull split is going to hit first can help you optimize your spray plan for maximum efficacy.
These factors all impact effective spray timing. For example, 2017 was a year of heavy NOW damage partially because of poor sanitation due to heavy winter rainfall but spray timing may also have played a part. The chart below shows when growers applied sprays relative to hull split in 2017 and 2018; two hull split sprays and the third if applied.
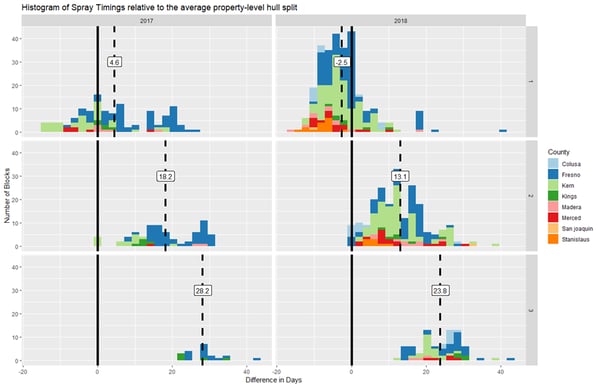
State-wide hull split spray timings relative to non-pareil hull split for the sprays 1 - 3
Many growers were unable to make timely hull split sprays in 2017 due to the high amount of rainfall which prevented equipment from entering the fields. In 2017, growers applied the first hull split spray on average 4.6 days after hull split. In contrast, in 2018, most growers applied their NOW sprays before hull split, with growers applying hull split sprays on average 2.5 days before hull split. 2018 was reported as having less NOW damage compared to 2017.
Hull Split Spray Timing Tools
Semios' hull split model provides a 90 day hull split prediction so you can get a head start on planning logistics and better time your NOW sprays. The hull split model provides:
- A hull split forecast by on-farm weather stations for different almond varieties.
- A per-acre hull split forecast to help identify warmer areas of your farm where almonds may be splitting earlier. This is particularly helpful for planning logistics on larger ranches.
Semios' Per-Acre Hull Split Forecast
Inducing Deficit Irrigation Around Hull Split
Water management is important for NOW management at hull split.
Well-timed deficit irrigation helps advance splitting and dry your nuts out more quickly and the regulated stress can reduce the window of time that your orchard is vulnerable to damage. You can read our guide on deficit irrigation around hull split for more tips.
By using Semios water management tools, you can make more informed decisions and maintain your trees' stress at the desired level:
1. Use soil moisture graphs to ensure you're inducing stress at the desired level.
Based on the MAD (Management Allowable Depletion) target you set and using data collected from soil moisture probes, the Semios Available Water Content Graph provides clear color-coded regions for different water deficit levels. You can use the ranges to stay within the desired deficit level and adjust your irrigation plans accordingly.
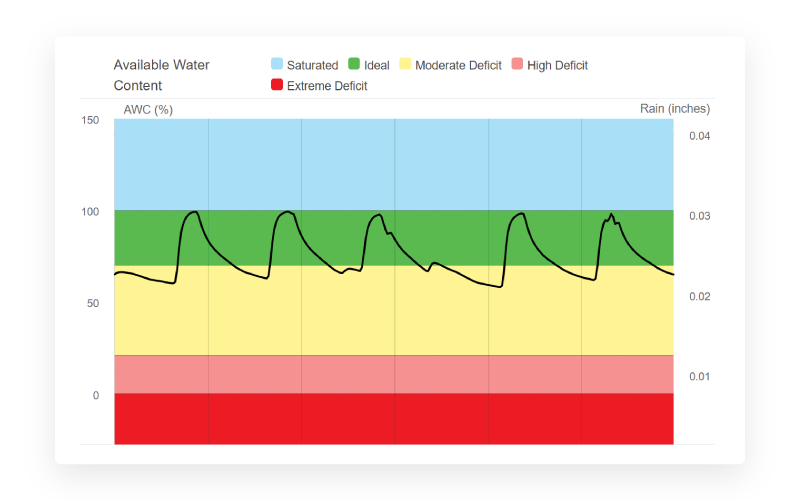 Semios' Soil Moisture Graph
2. Dendrometers can be used to indicate your trees’ stress level based on trunk displacement.
To prevent causing long-term damage to your trees from the induced water deficit, you can refer to the Plant Stress Graph. This graph shows your trees' stress levels based on maximum daily shrinkage (MDS) data collected from dendrometers.
This is a good way to double-check that your deficit irrigation strategy is working properly and not causing excessive stress for your trees.
However, not all dendrometer-based plant stress tools are the same, and you can read more about the science behind the Water Stress Index that powers Semios' plant stress insights.
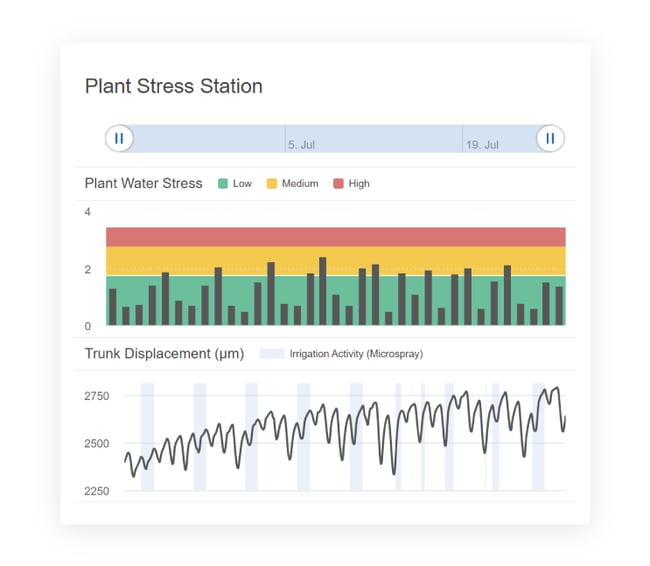 Semios' Plant Stress Graph
Compare Your Spray Timings With The Rest Of The Industry
Using the Semios Almond Management Tool, you can check your spray timing and see how it compares with other almond growers:
- See block-specific hull split times (1)
- Overlaid onto trap captures (2), showing how well their NOW flights and sprays lined up to hull split
- The dotted lines (3) indicate the industry average of hull split spray timing
- The shaded areas (4) show the full spectrum of spray timing
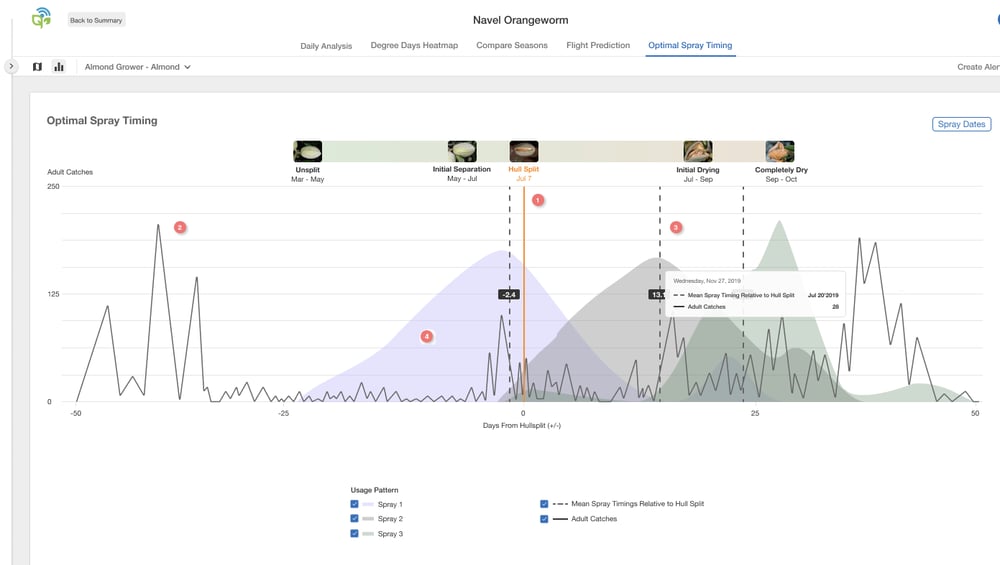
The Semios almond management tool helps you check your spray timing by showing: (1) Block specific hull split (2) Trap captures (3) Average hull split application times (4) Hull split application times relative to hull split
How to Evaluate Your Hull Split Spray Program
Here are some questions you can use to guide your evaluation of your hull split spray program:
- Are your hull split predictions far enough in advance to plan sprays?
- How are your spray resources being allocated? (e.g. high pressure blocks, high value crop/cultivar/nut type)
- Are you choosing the right product based on application timing?
- Does your spray program align with NOW activity in your orchard?
If you have any questions, our entomologists, PCAs, and Irrigation Specialists can help. Leave us a comment below or check out the blog posts below for more management tips:
- Late Spring Almond Irrigation
- Deficit Irrigation Around Almond Hull Split
- Why You May Want To Rethink Hull Split Applications At 1700 Degree Days
-
Comparing Degree Day Sources For Tracking NOW Generation Flight Prediction
References:
How Much Does Navel Orangeworm Damage Cost?