We have all had a good laugh at poor translations on packages, signs, and T-shirts that are often posted online. As amazing as Google Translate and other machine translation software may be, they still have some difficulty managing the nuances between languages.
So, we shouldn't be too surprised when we find some difficulty in "translating" signals from trees and vines.
Yet, not many companies talk about this problem.
Decades of research have provided us with a lot of experience in interpreting soil and atmospheric signals. However, newer technologies such as dendrometers that measure changes in the width of a tree trunk are still a little difficult for us to interpret. (If you're unfamiliar with dendrometers, we've covered the topic in a previous blog post that goes over the basics.)
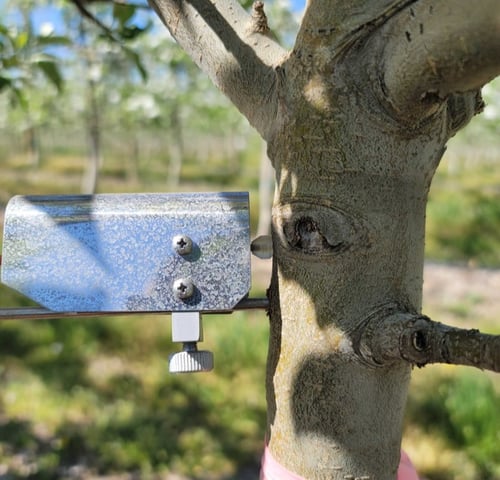
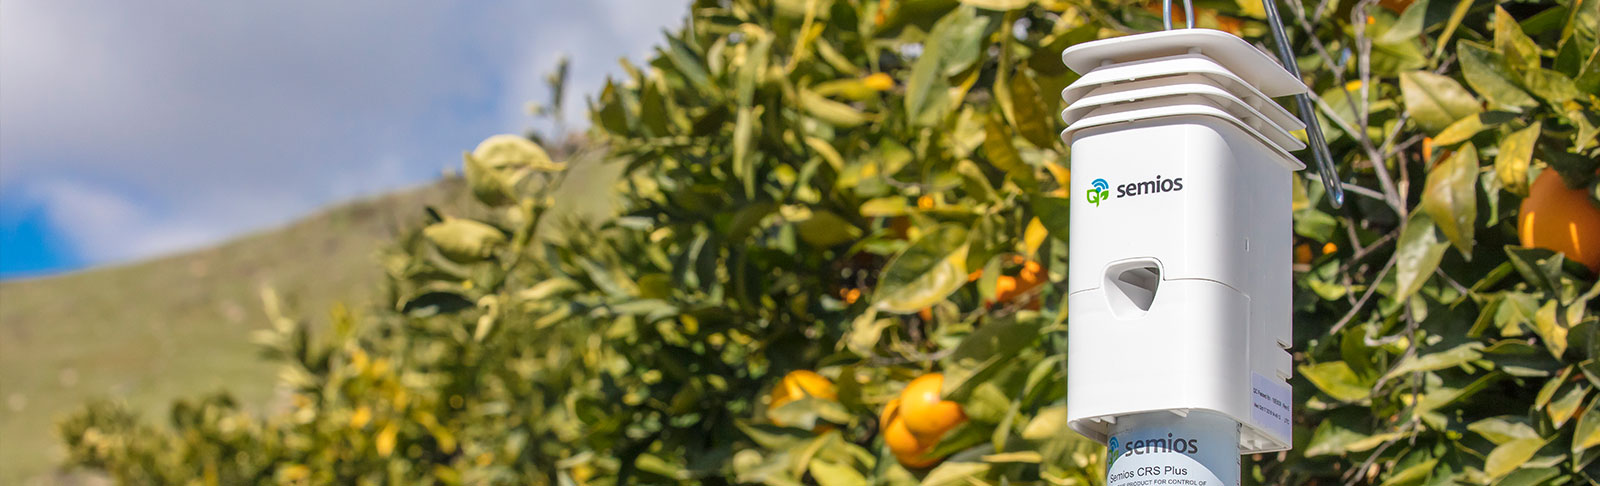
Figure 1. Dendrometers such as this one help collect raw data that then needs to be "translated" to be meaningful for growers and irrigation managers.
On its own, trunk dendrometer data is Greek to us—it doesn't make a lot of sense. However, specialized analytic tools, such as a water stress index, can convert all that gibberish into something more meaningful and actionable to us.
Just as language has a big impact on the way we perceive the world around us, our interpretation of our trees' "language" through the lens of a water stress index alters how we make irrigation decisions.
What is a water stress index?
The Rosetta Stone was a major archaeological find that provided a sort of "index" that allowed the deciphering of Egyptian hieroglyphics that were previously beyond our grasp of understanding.
The stone contained the same text written in three languages. Two of the three languages were known already (Greek and one dialect of Egyptian). By cross-referencing the known languages with the third unknown language, they were able to assign meaning to the individual characters and crack the code that has enabled our current understanding of ancient Egyptians.
A water stress index acts like the Rosetta Stone. It helps to decipher data that is just noise and provide meaning to the meaningful data that is still there.
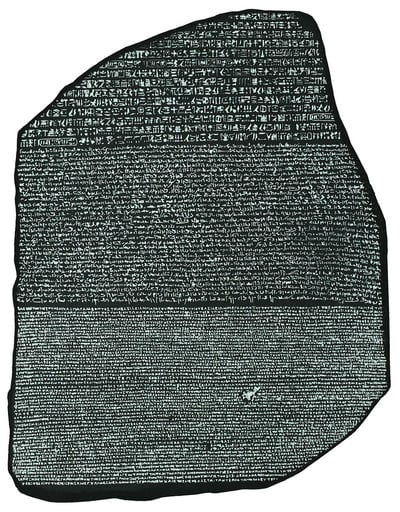
Figure 2. An image of the Rosetta Stone. A water stress index is like the Rosetta Stone for dendrometer data, translating difficult-to-interpret raw data into usable insights into the tree's plant stress state.
An effective index will also make it possible to "translate" the data into other measurements that are already known or better understood, such as Stem-Water Potential.
Current problems with industry-standard water stress index
1. Lack of robustness
Early academic research has provided an initial water stress index that is a first step in learning to interpret trunk radius measurements.
However, it is not very robust. If anything interrupts the measurement, it won't work any longer. Because of this, most dendrometer providers charge extra to place more dendrometers than necessary so that if one of several devices fail, they will still have equipment in the field collecting measurements.
2. Poor translation of dendrometer data
Many dendrometer providers are fond of saying that they can "speak with the plants." However, measuring a plant doesn't count as understanding a plant. Data taken directly from the plant provides an important piece of the entire picture, but only if it provides information we can act upon.
Unfortunately, the current water stress index is not very effective in translating the measurements into something meaningful. The measurement from one tree and the one next to it can vary to a degree as to make them both unintelligible.
Even when a clear measurement is made, the index is not very effective at turning it into something we already understand, and the thresholds it provides are not based on any solid evidence of ideal circumstances.
This water stress index is the current standard in the industry. It is used by all companies providing dendrometers, and it is the index that Semios used as we began our own research into dendrometers.
Introducing the Semios Water Stress Index
It didn't take us long to realize that a more robust, accurate, and complete index was needed to make use of dendrometer data. Thus, we at Semios, set out to create our own water stress index.
Our goal? To develop an index that:
- Provides a more complete "translation" of the data for the most accurate intel
- Is more reliable and robust for harsh orchard conditions
- Is easy to interpret for accurate, fast, and easy decision-making
After years of research with dendrometers, we're excited to finally share the Semios Stress Index with you all. Here are some of its key features.
1. A reliable real-time substitution for stem-water potential
In Figure 3 below, you can see that the Semios Stress Index is strongly correlated to the measurements that you can perform with a pressure bomb, making it a reliable substitution for measuring stem-water potential. Additionally, unlike pressure bombs, dendrometers have the benefit of being able to provide easy-to-access, real-time measurements.
Our index is also normalized, which means the values from one tree can be compared to those of another tree in a different block. In our user interface, a Stress Index of 1 or lower means low stress (indicated in green), between 1 and 2 means medium stress (yellow), and higher than 2 means high stress (red).
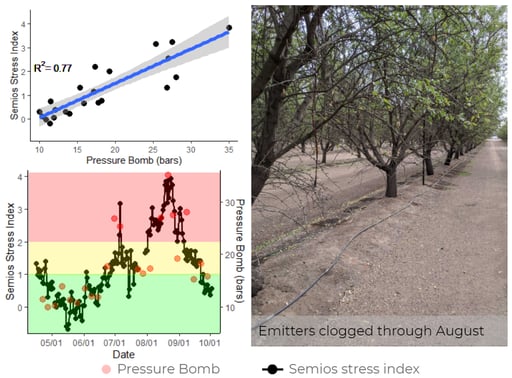
Figure 3. Strong correlation between stress index derived from trunk dendrometer and pressure bomb measurements (upper left panel). Semios Stress Index reported severe stress when there is a problem in the irrigation system (lower left panel). The picture was taken at the study site where a good proportion of the emitters were plugged throughout August (right panel).
The experiment in Figure 3 was performed in an almond orchard near Chowchilla, California. During August, we started to record really high readings of the Semios Stress Index in our dendrometers. When we looked at the irrigation records, we could not find an explanation for such high stress. It was when we visited the site that we realized the high stress reported by our dendrometers was due to serious obstructions of the drippers throughout the entire site.
2. Highly responsive to irrigation events and informs whether the irrigation applied is enough to avoid stress
We have also verified how useful the Semios Stress Index is in citrus.
It can be really challenging to know when we are applying enough water during the hottest part of the year. There may be many irrigation sets with different water demands, and irrigation events may not always be as long as we want. This can make it hard for irrigation managers to know when they are falling behind in a block.
In Figure 4 below, there are several periods during late July and August in which the applied irrigation amounts are not enough to keep the trees stress-free. Irrigation managers can use the Semios Stress Index to know which blocks need more urgent attention and avoid severe stress.
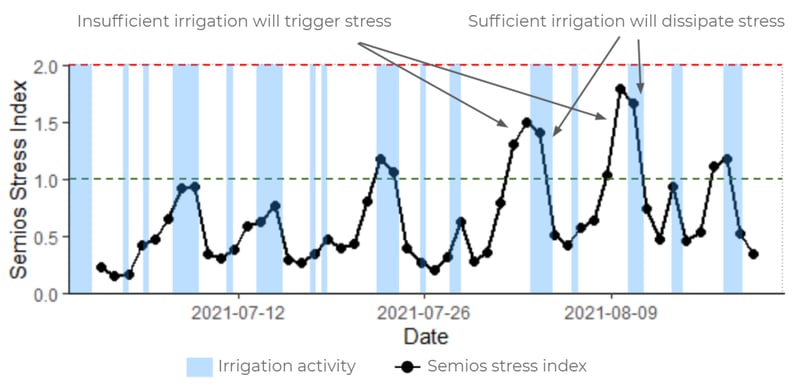
Figure 4. In this chart, periods of irrigation are indicated by the blue bars and readings from the Semios Stress Index are shown as the black line. The Semios Stress Index responds by decreasing when irrigation is sufficient and increasing when irrigation is too spaced or insufficient.
To demonstrate how a typical user will interact with the Semios Stress Index, here is a screenshot of how the data is displayed on the Semios web application.
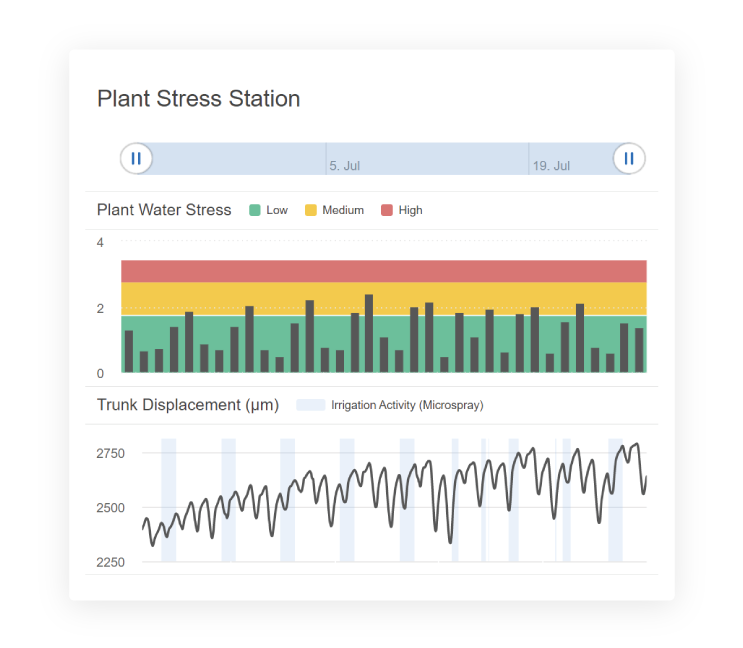
Figure 5. A view of the Semios Stress Index on the Semios web app. Green indicates low stress, yellow indicates medium stress, and red indicates high stress.
Although values higher than 1 of the Semios Stress Index are considered medium stress, Semios users can edit those thresholds accordingly based on what they consider is an acceptable level of stress.
3. Sensitive to small variations in the amount of water applied and only shows stress values when the trees are not receiving enough water
In order to test the sensitivity of our stress index, we performed a replicated trial in which we changed the emitters used by the collaborating grower with emitters that delivered either 20% or 40% less water.
In Figure 6 below, the blue line (showing the Semios Stress Index readings based on the full water amount applied by the grower) had values lower than 1 for most part of the season. This means that the irrigation manager at the study site, who watered amounts close to full crop requirements, avoided even moderate water stress for the most part of the season.
However, when irrigation events were spaced apart in time, those trees receiving a reduction of 20% or 40% of water allocations often reported moderate and severe stress values, respectively (as shown by the orange and yellow lines). This finding suggests that the Semios Stress Index is able to perceive small variations in water amounts and consistently reports stressed values when the water applied amounts are insufficient.
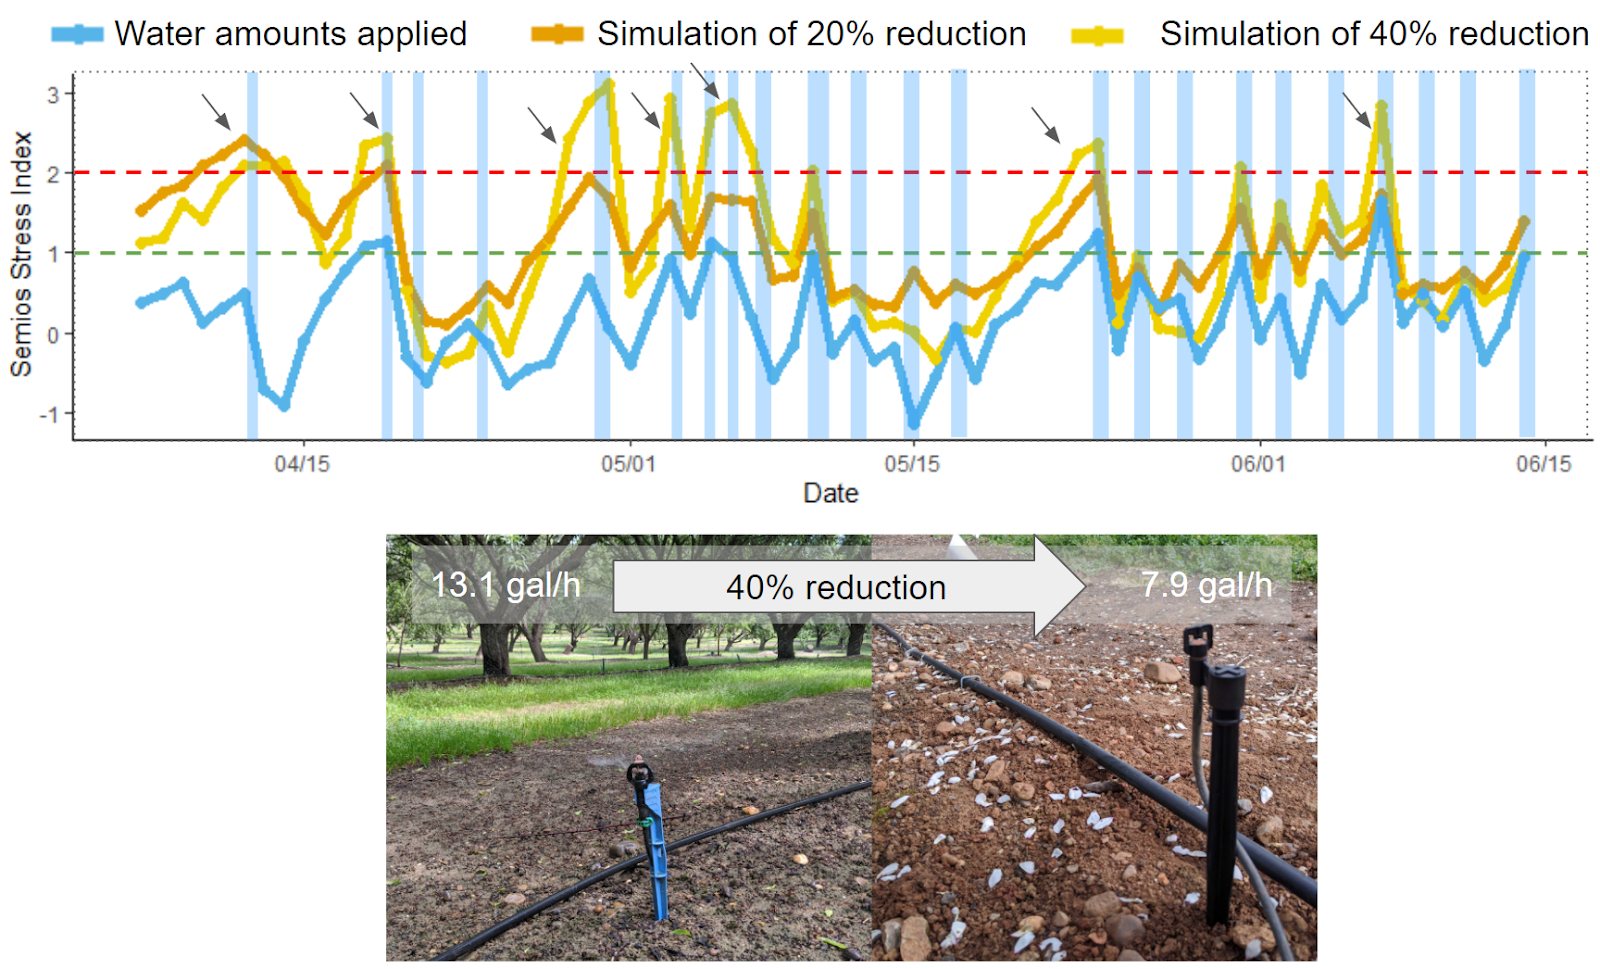
Figure 6. In a replicated trial, the Semios Stress Index was able to differentiate between different water-deficit treatments. The light blue vertical bars in the chart show irrigation activity, while the blue, orange, and yellow lines show readings of the Semios Stress Index based on different levels of water applications. 20% (orange line) or 40% (yellow line) reductions in water applied triggered moderate (>1) and severe (>2) water stress according to the Semios Water Stress Index.
Conclusion
As with any emerging technology, there is a lot to learn about trunk dendrometers and there are improvements that will need to be made to the Semios Stress Index.
However, we are confident that our model provides the most accurate translation of the data, the most foolproof capture of data, and the best thresholds currently on the market.
As always, Semios is continuously looking to improve what we have already. As more and more dendrometers are deployed into the field, we will further refine the index until it is fully understood and provides clear direction in conjunction with other data. We are excited to provide this advancement to the technology and to see what we can help you accomplish with it!