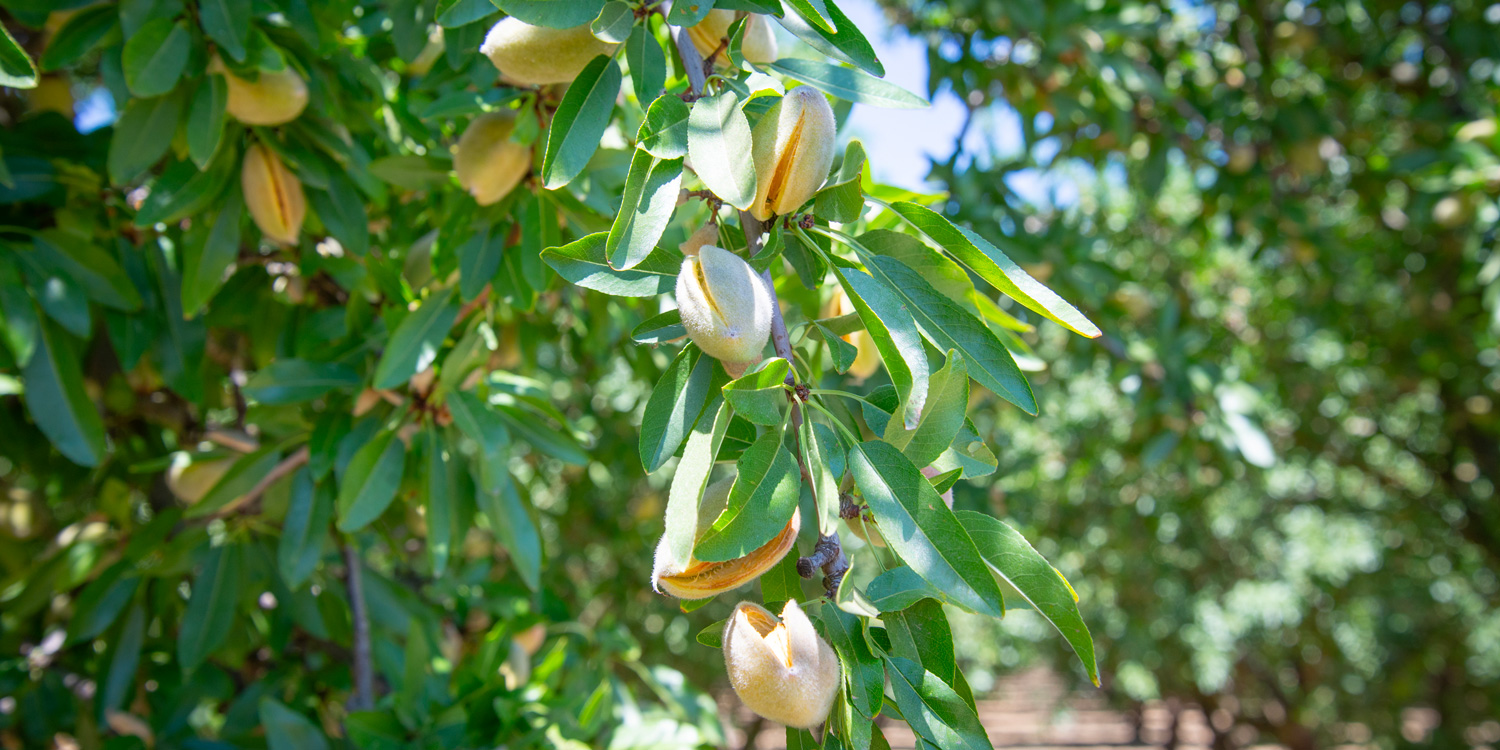
With the end of July approaching, almond harvest has begun in some area, depending on variety, location, and crop maturity.
As of July 17th, here’s how the average degree days are currently looking based on the Semios network of in-canopy weather stations:
-
Northern California: ~1882 NOW degree days
-
Central California: ~1870 NOW degree days
-
Southern California: ~2185 NOW degree days
Many growers have completed their first and second hull split sprays, while some are preparing for a third based on local conditions and hull split progression.
Streamline pest decisions with the new Semios Pest Dashboard
The new Semios pest dashboard brings this data into one place allowing growers and crop advisors to quickly access pest pressure and treatment timing without having to piece together information from multiple sources.
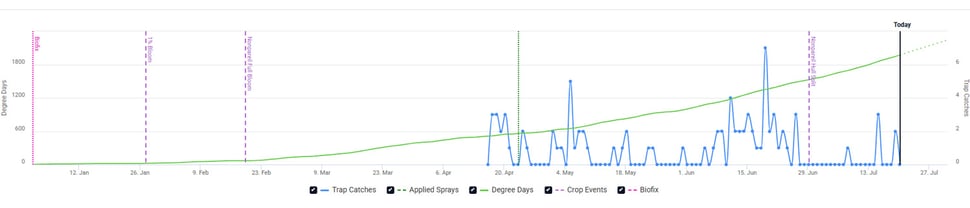
Example of a navel orangeworm dashboard in Semios Hub
This dashboard combines the following information:
-
Degree day accumulation
-
Trap catches
-
Biofix dates
-
Key crop events, such as hull split predictions
The graph allows growers to compare degree days with pest development stages and critical crop events, making planning sprays easier.
You can also use the dashboard to compare multiple weather stations within the same orchard. Because pest development is temperature driven, degree day accumulation and hence pest pressure can vary significantly across different microclimates in the same orchard. This feature allows growers to identify which areas in the orchard are developing faster to better manage spray timing across the orchard.
The dashboard also features a historical trap counts table that shows a summary of pest activity. The table shows total catches from today, past 7 days, past 14 days and year to date. This allows growers to catch hotspots and determine if additional management is required, helping make data-driven pest management decisions throughout the season.
Learn how to access the new pest dashboard feature in Semios Hub.


.png?width=352&name=Cumulative%20NOW%20Degree%20Days%20-%20April%201%20Biofix%20(1).png)
.jpg?width=352&name=_MG_4097%20(3).jpg)