Degree day tracking is a common integrated pest management (IPM) practice used to predict the phenology of orchard pests such as navel orangeworm (NOW) (Amyelois transitella). Degree days are used to predict navel orangeworm generations and egg hatch, allowing growers to target vulnerable life-stages (e.g., young larvae) with insecticide applications. To do so, degree days are accumulated from a point in time until a given threshold is met, indicating pest emergence.
Historically, growers and Pest Control Advisors (PCAs) have calculated degree days by relying on temperature data generated at a regional level and distributed by various agencies. However, recent advancements in technology have made it possible to collect temperature data at the individual orchard and management zone levels.
Knowing that degree day tracking is a key predictor of pest activity, this case study suggests that in-canopy temperature should provide a more accurate data source to inform navel orangeworm integrated pest management.
The Temperature Data Sources
In this case study, we compared navel orangeworm degree day accumulations based on temperature measurements from three data sources over two years.
-
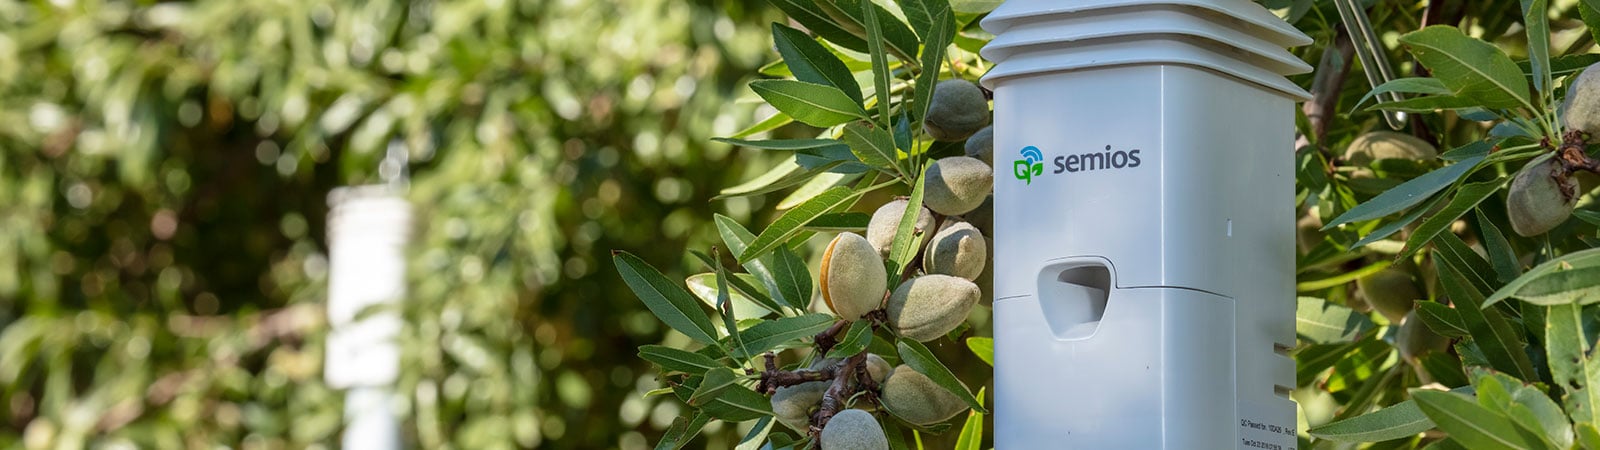
Semios: The first data source is Semios-managed weather stations located within the canopy of 13 commercial almond orchards throughout the southern San Joaquin Valley of California.
-
Model-Based: This second data source is a proprietary third party climate model which produces temperature predictions at the same specific GPS coordinates of the Semios weather stations previously mentioned.
-
Regional: The third data source is a regional network of publicly accessible weather stations located throughout California.
We compared predictions of navel orangeworm’s generational timings based on temperature data recorded in an orchard, with that of the closest regional weather station, and with modeled data for that orchard.
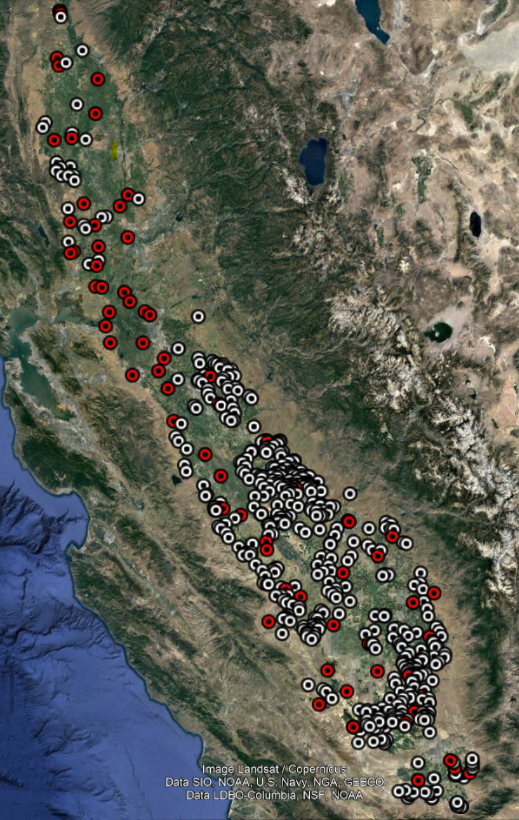
The map below gives you an idea of the different data sources' coverage throughout California's Central Valley.
-
Semios weather stations = white
-
Regional weather stations = red
We observed that generational timing predictions from both regional and modeled weather data were on average 6.25, and 8.50 calendar days ahead of those generated from in-orchard weather stations for the first and second generations of navel orangeworm, respectively, from a biofix of April 1.
Given that growers and PCAs make critical and costly decisions based on degree day tracking, variation in accumulation of one week or more can have a significant impact on insecticide application efficacy.
NOW Integrated Pest Management
During hull split, there is approximately a four-day window between when an egg is laid to when it hatches. At which point, the larvae make their way into the nut and are considerably protected from sprays.
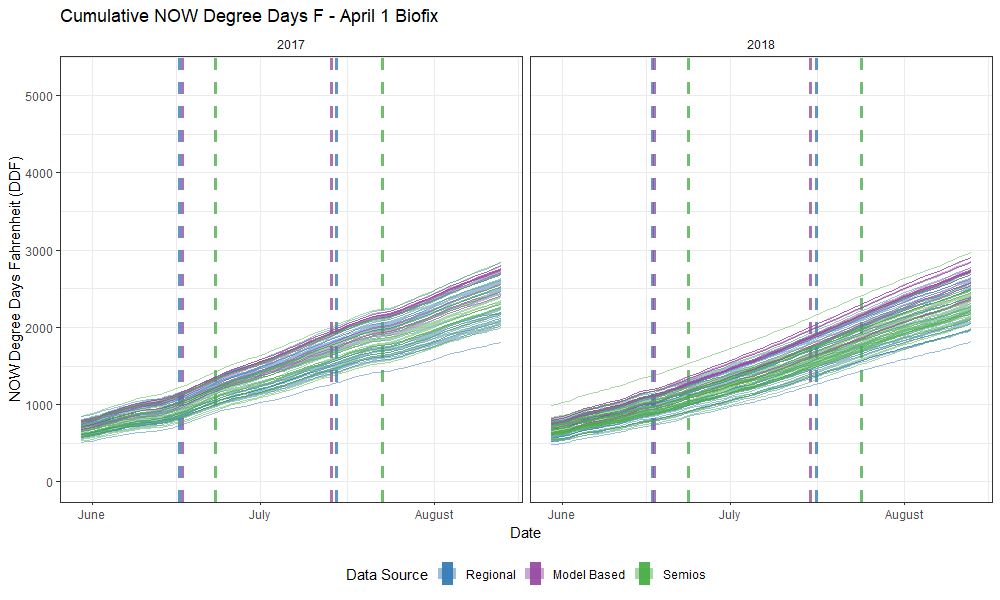
Figure 1.0
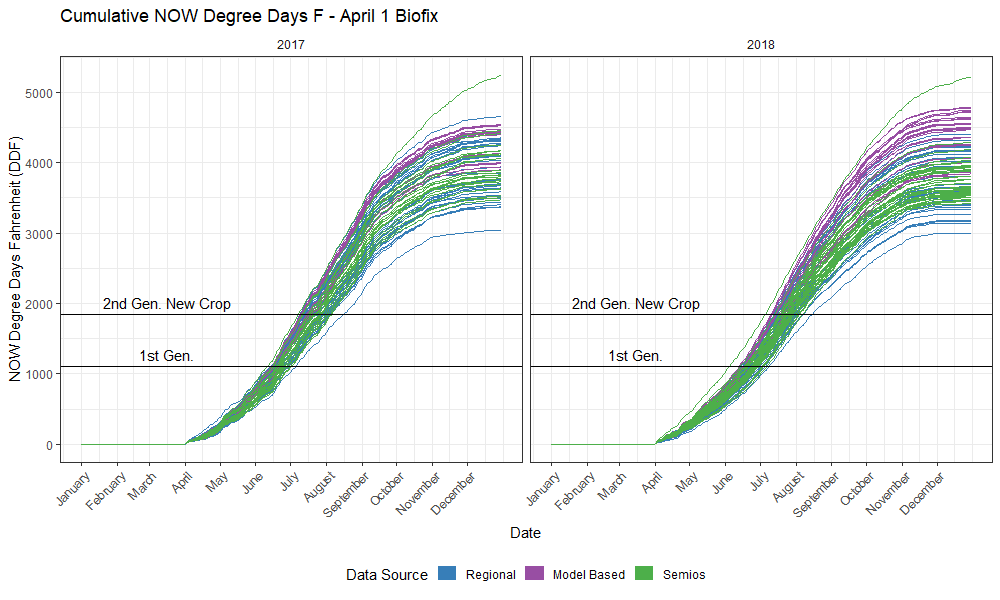
Figure 1.0 shows the cumulative NOW degree days from an April 1 biofix. In general, we see no difference between years, but a significant difference between sources.
In this example, we see that the regional and model data sources predict earlier generations than Semios.
-
1st generation: 6-6.5 calendar days early
-
2nd generation: 8-9 calendar days early
Figure 1.1
When we look closer, Figure 1.1 shows the same early predictions for first and second generations of NOW. To put this into context for spray timing, the vertical, dashed lines show predicted NOW flights.
If a grower sprays too early, there will be decreased efficacy against NOW larvae due to residue degradation. Too late, and the spray will be ineffective as it will not make contact with the susceptible life stage of the pest.
Based on spray trail data (Hamby et al. 2015), we believe that poor spray timing could feasibly cause a base damage of 1.5% to increase to at least 1.65 -1.9%.
If an almond crop is worth $6,250 per acre, an inaccurate insecticide spray timing leading to an increase in damage of as little as 0.4% would translate to a loss of $25.00 per acre, per variety.
Conclusion
Use of regional, model-based, or Semios managed temperature data sources may result in different orchard management decisions.
Both regional, and model-based temperature data sources suggest earlier application timing than Semios. If insecticide products are applied too early, they may be less effective. For example, if poor spray timing increased damaged by 0.4% this would result in a loss of at least $25.00 per acre, per generation.
Collecting temperature data from inside the orchard’s canopy allows growers to more accurately predict NOW generations for optimal spray timing.
Related: