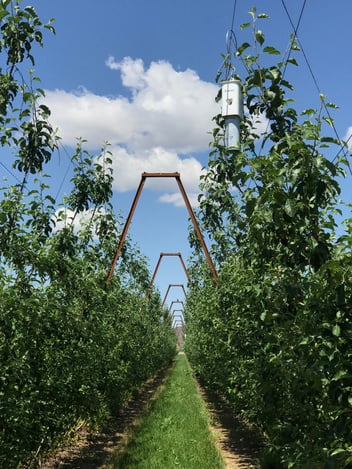
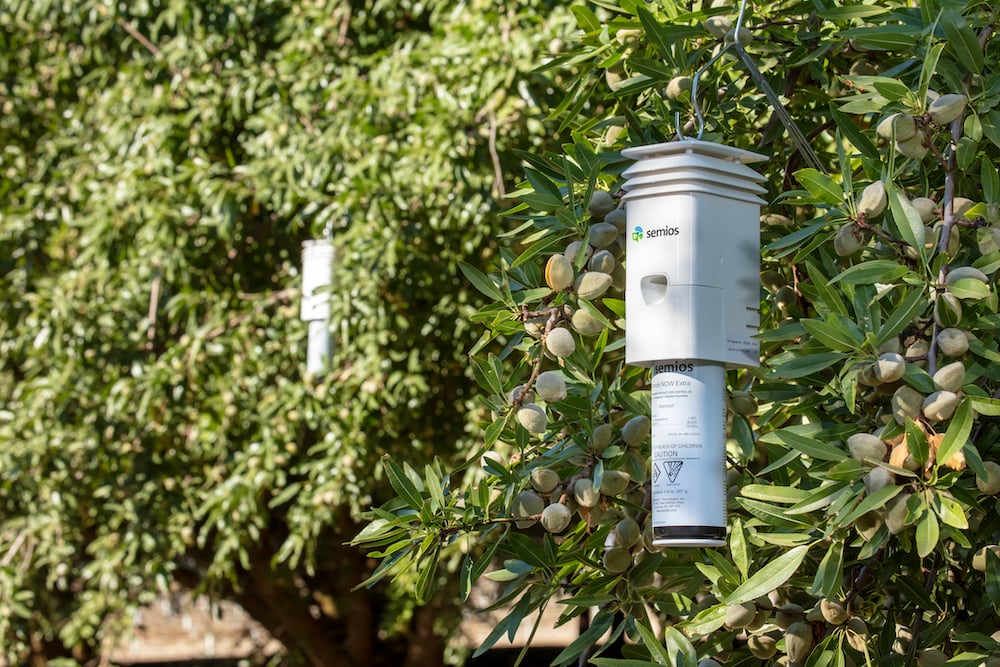

In-canopy weather stations and sensors are steadily growing in popularity across the western US. Thanks to new advances in agriculture technology, growers can now access in-orchard weather stations and sensors that were previously unavailable, or unaffordable. This new access to microclimate data is allowing growers and their consultants to make informed and precise decisions in real-time, resulting in higher quality and higher value yields.
What is a microclimate? A set of very-localized atmospheric conditions (temperature, air pressure, humidity, etc.) that can vary slightly, or substantially from the conditions of the surrounding area.
How Your California Crop Benefits
Efficient irrigation practices
Micro-climate conditions can vary considerably from one acre to the next, even over homogeneous and contiguous crops. With in-canopy weather stations, you’re able to take a more targeted and efficient approach to irrigation practices because you’ll know exactly where climatic variation is occurring in your orchard.
Accurate degree-day reporting for effective spray timing
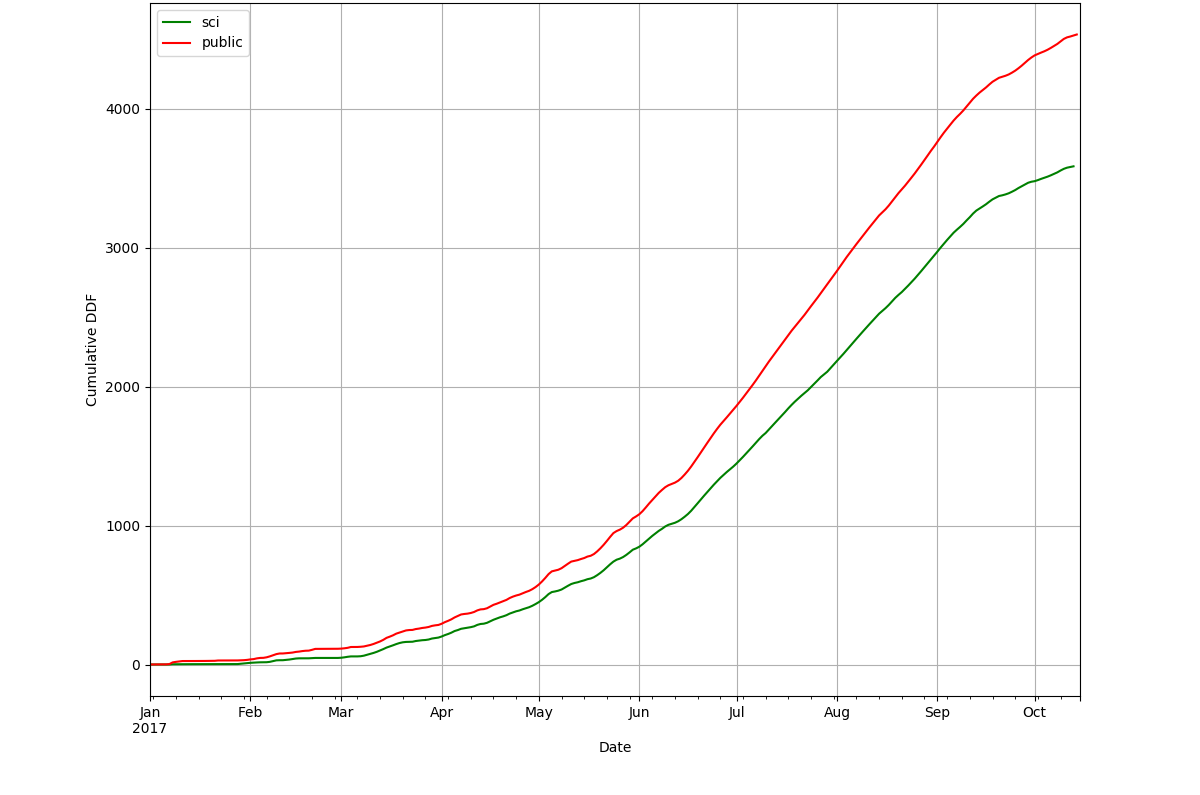
The graph below shows the difference between in-canopy weather stations and the nearest public station 1.7 miles away. By August, the degree-days differ by more than an entire generation of navel orangeworm (NOW).
If you are timing your sprays to degree-day applications using regional weather data, you risk missing optimal application windows which could lead to needing additional applications throughout the season for adequate coverage. In-canopy weather stations, combined with automated notification of target conditions, allow for more precise timing of material applications for greater impact.
NOW degree-days in-canopy vs. nearest public weather station 1.7 miles away
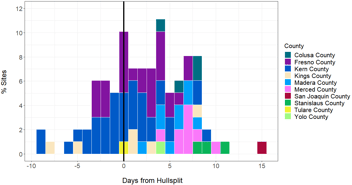
The next graph shows the calendar-day difference in NOW degree-day accumulation between an in-canopy station and a regional public station located 2.4 miles away. The red dotted line at zero would be perfect agreement in degree-day accumulation between the two stations.
DD accumulation timing difference between on-site data and regional public data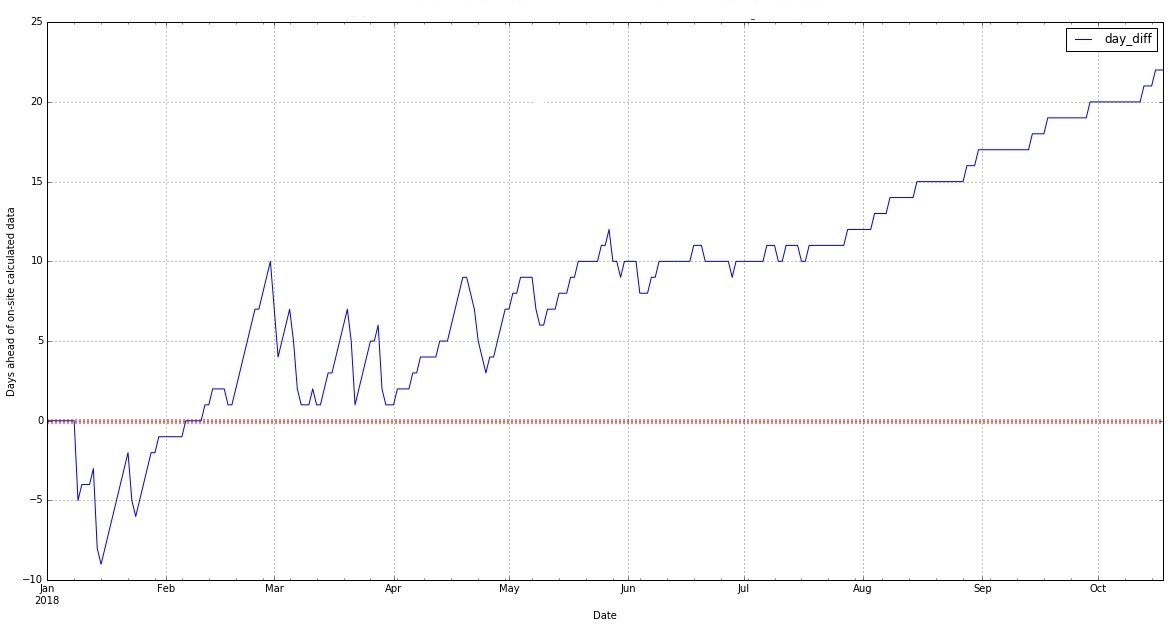
These kinds of observations can be missed by public weather stations that are not taking the measurements from within the canopy. In a September 2018 issue of Pacific Nut Producer, University of California Cooperative Extension Farm Advisor, Robert Beede says,
"I have cautioned you for years about using a [local] station for pest management. Depending upon their location and maintenance of the grass area surrounding the instruments, they can read high, and mislead you into spraying too early. Navel orangeworm is so serious that all growers should have weather collection systems in their orchards" .
Better disease risk management
Tree diseases thrive in warm, humid weather. To make things even more complicated, symptoms of diseases are often not visible until days or weeks after initial infection events. This makes prevention a challenge.
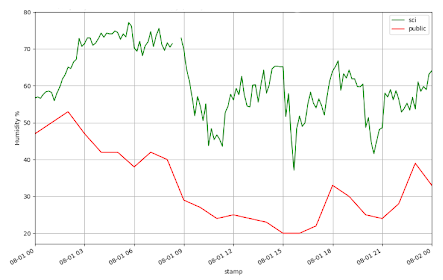
In the next graph, you can see a considerable difference in humidity levels between the closest regional public station and the in-canopy weather station. Without precise in-canopy weather data, you could underestimate the disease risk facing your crop and neglect to take the proactive measures to mitigate it. In-canopy weather stations and sensors allow you to stay ahead of disease risk in your crop and help you target the exact locations where the threat is greatest.
On-site in-canopy (every 10 min) vs nearest public station (hourly) 1.7 miles away
Accurate chill data
Having an accurate understanding of the chill portions or hours your crop has accumulated is essential in planning orchard management practices for the spring. Without adequate chilling, your crop is at risk of a reduced nut set, reduced quality, and delayed or extended bloom or foliation.
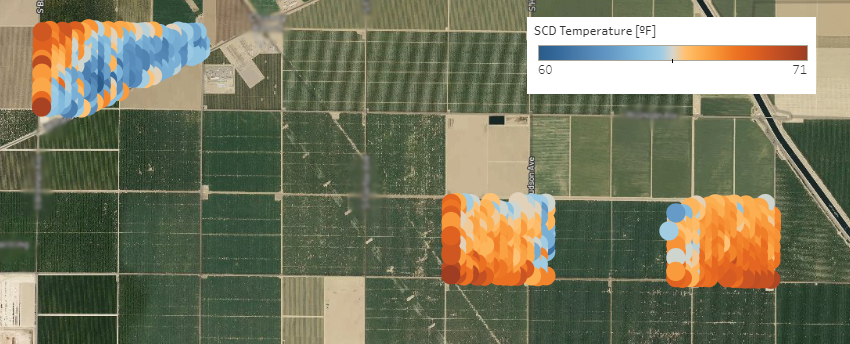
Some potential causes for the trends we are seeing in the video below could be prevailing winds coming out of the northwest or the level of sunlight the crop gets throughout the day based on the sun rising in the east and setting in the west.
Although notable variation can occur spatially, the impacts of microclimate variation can be realized to an even higher degree when considering the effects on model outputs like chill hour accumulation over time.
Related: Comparing Degree Day Tracking Sources for Navel Orangeworm Generation Flight Prediction